
More Information
Submitted: April 15, 2021 | Approved: April 23, 2021 | Published: April 26, 2021
How to cite this article: Brunauer GC, Meindl A, Rotter B, Gruber A, Slouka C. A case report: Electrochemical impedance spectroscopy as an Al-ternative for cell counting chambers of yeast (Saccharomyces cerevisiae) for brewery applications. Arch Food Nutr Sci. 2021; 5: 027-031.
DOI: 10.29328/journal.afns.1001029
ORCiD: orcid.org/0000-0002-5313-0517
Copyright License: © 2021 Brunauer GC, et al. This is an open access article distributed under the Creative Commons Attribution License, which permits unrestricted use, distribution, and reproduction in any medium, provided the original work is properly cited.
Keywords: Saccharomyces cerevisiae; Viable cell count; Online biomass monitoring; Impedance spectroscopy (EIS); process Analytical technology (PAT)

A case report: Electrochemical impedance spectroscopy as an Al-ternative for cell counting chambers of yeast (Saccharomyces cerevisiae) for brewery applications
Georg Christoph Brunauer1,2*, Alina Meindl1, Bernhard Rotter2, Alfred Gruber3 and Christoph Slouka4
1Salzburg University of Applied Sciences, Campus Kuchl, Department Forest Products Technology and Timber Constructions, Markt 136a, 5431 Kuchl, Austria
2TU Wien, Institute for Energy Systems and Thermodynamics, 1060 Vienna, Austria
3Alfred Gruber GmbH, Nordstraße 6, 5301 Eugendorf, Austria
4TU Wien, Institute of Chemical Engineering, Gumpendorferstraße 1a, 1060 Vienna, Austria
*Address for Correspondence: Georg Christoph Brunauer, Salzburg University of Applied Sciences, Campus Kuchl, Department Forest Products Technology and Timber Constructions, Markt 136a, 5431 Kuchl, Austria, Tel: +43 50 2211-2709; Email: [email protected]
Advanced technologies, such as electrochemical impedance spectroscopy (EIS), are a valuable tool which can enhance and simplify the industrial process monitoring if used correctly. State-of-the-art approaches for screening the cell growth of for example yeast during the brewing process still heavily rely on offline methods such as methylene blue or florescence dye-based staining, and/or the usage of flow cytometric measurements. These methods, while being accurate, are very time consuming and require heavy manual effort. Furthermore, the time span needed to obtain the counting result can lead to a time-delayed response signal and can impact the quality of the final product. In recent studies, applications of low-frequency EIS in the α-regime were used for the determination of cell counts and the metabolic state in Saccharomyces cerevisiae. This method has proven to be a reliable tool which has also shown high potential in industrial scale applications. The online biomass monitoring, as well as viable cell count, for feasibility study was performed in-house at Stiegl Brewery in Salzburg/Austria founded in 1492.
Microbial cultivations play an essential role in many different fields, such as in food, bulk chemicals and pharmaceutical production, as well as in waste-to-value concepts [11-14].
The necessity to cultivate different microorganisms in industrial applications, such as for example food industry, has led to the need of detailed process monitoring in order to circumvent problems related to changes in pH or dissolved oxygen [1]. Over the years off-gas analytics have proven to be valuable tool which can be utilized in a plethora of applications without a cause for concern regarding health and safety. One of the most important parameters used in cultivation processes is the biomass, which is still in this day and age mostly determined through manual cell chamber counting. At the same time, for example in the brewing business, often a variation for example in the viable cell concentrations (VCC) can cause diminished quality of the end products [2,3]. Hence, advanced measurement techniques are required to facilitate efficient in situ monitoring processes while at the same time being inexpensive. Electrochemical impedance spectroscopy (EIS) is a powerful tool in life science and has been heavily investigated for its potential to characterize the microbiological behavior during cultivation processes. The capacitance probes used for such applications are all based on β-dispersion (107–104 Hz). Unfortunately, these probes show a high dependence on process parameters (e.g., stirring, temperature, pH, salt and substrate concentration, etc.) [4,5] and hence, cannot be used for detailed monitoring in industrial processes. In order to circumvent these limitations, we exploited a different physical phenomenon (α-dispersion) at frequencies below 10 kHz, which provides valuable information regarding the biomass concentration. Our goal was to develop and test the novel application for low frequency electrochemical impedance spectroscopy in online measurements in a preliminary study at lab-scale and then to transfer the measurement technique to an industrial propagation process in the Stiegl Brewery in Salzburg/Austria [8]. The valuable preliminary work was done in several own studies, see elsewhere [6,10].
The state-of-the measurements viable cell counting for production of bulk foods, such as breweries, are generally based on Thoma cell counting chambers. Online measurement of VCC in the brewing industry has not been established yet because there are historical reasons. Such tests have to be affordable, simple, robust and reproducible [7]. In this feasibility study the cell counting measurements took place at the Stiegl Brewery and were performed using Thoma cell measurements, as shown in figure 1a. The number of cells in the suspension, containing Saccharomyces cerevisiae, is defined by the following equation (1)
(1)
where 400 x 104 represents the factor of Thoma chamber in figure 1b. The differentiation between living/dead cells was performed by using methylene blue dye-based staining.
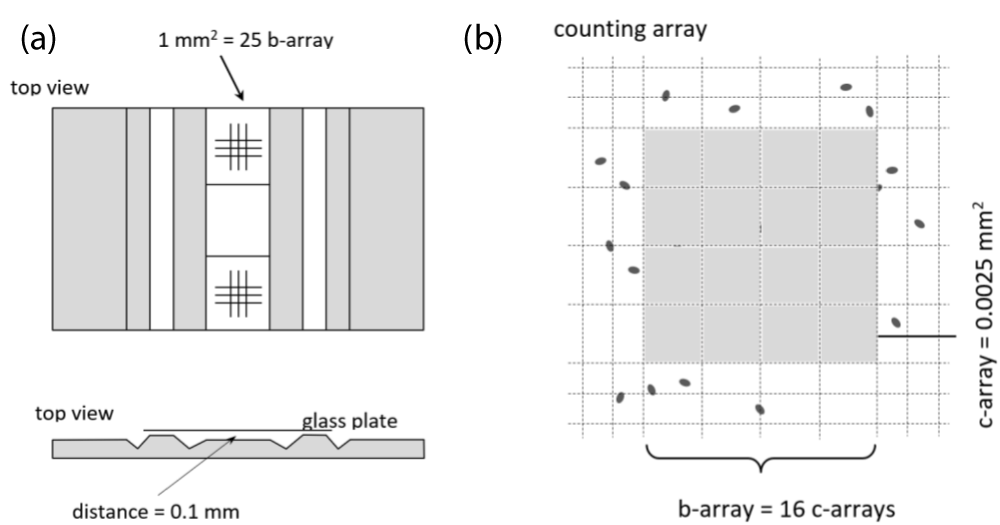
Figure 1: (a) Scheme of a Thoma cell counting chamber; (b) the inlay of the counting chamber contains a large central array with an area of 1 mm2 which can be counted by using a 10X microscope.
Experimental details concerning the Expression Host, the cultivation for S. cerevisiae and the analytical methods utilized can be found in [8].
Measurement setup
EIS measurements were recorded in the range of 106 to 10-1 Hz with amplitudes up to 100 mV using the N4L PSM 1735 frequency analyzer (Newton4th Ltd., Leicester, UK). We were aiming novel monitoring processes, developing a sophisticated probe, while at the same time keeping the ease of handling and the accuracy of the obtained data at the forefront of our mind. The case study involved several steps, including the construction of an online prototype. Furthermore, the generation of an impedance signal, its link to a viable cell concentration (VCC), and the implementation of the probe and its testing in real-life conditions had to be undertaken.
Initial measurements were undertaken utilizing a 10 L stainless-steel Sartorius Biostat Cplus bioreactor containing a strain of S. cerevisiae. As lab scale experiments gave very promising results, the transfer to an industrial propagation reactor at the Brauerei Stiegl in Salzburg was initiated. The industrial reactor was a 1500 L stainless-steel propagator, with alternating aeration and pumping of the broth. In order to keep sterility of this large setup, samples were taken and transferred to a custom-made reactor with our probe in order to undertake the subsequent impedance measurements. The large-scale setup as well as the online probe design can be seen in figure 2.
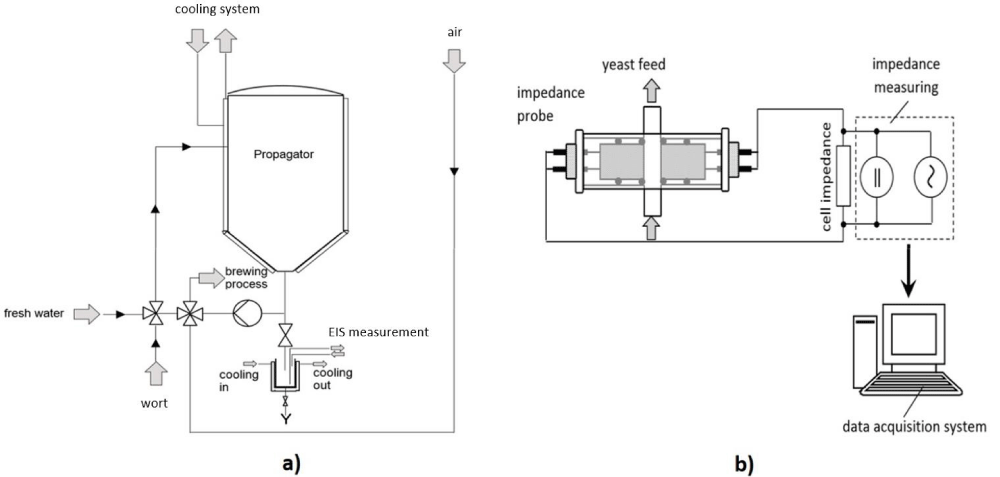
Figure 2: (a) Propagation reactor including sampling port and cooling/sampling device built for measurement [38]; (b) impedance measurement principle including online measurement probed developed [8].
This case study existed of a two-step experimental layout in order to guarantee the successful conversion from a laboratory scale to a real-life industrial scale. The goal was to develop and provide prove of principle for the industrial yeast propagation step in the Stiegl brewery. It has been shown that the effective number of cells after the propagation can directly affect the quality of the produced product. Hence, a reliable system that could determine the viable cell number and state of the metabolic cycle would not only simplify this step but would result in a significant enhancement.
Laboratory scale propagation
The initial test of the novel measurement technique which is based on α-dispersion was performed in a 10L fermenter for the lab-scale testing. In order to be able to effectively compare the laboratory measurements with the industrial tests the raw materials and yeast was already provided by the Stiegl brewery. The microbial growth was constantly monitored and kept aerobic with a dissolved oxygen quantity of over 70% and a growing temperature of 12 °C. Process analytics were reported including sugar/ethanol data and OD600 and dry cell weight (CDW). The collected data was in accordance with literature and showed well-known behaviour for S. cerevisiae during cultivation. The viability was also monitored with flow cytometry and revealed almost no cell death. The obtained data was fitted utilizing an offset resistance for cable and contact resistance and an ideal capacitor equivalent circuit element for the double layer capacitance. This resulted in an equivalent circuit which was fitted by complex non-linear least square fitting. The data seen in figure 3a stems from the impedance signal after linear fitting. Due to the high fitting quality the CDW was predicted based on these results. As the industrial brewery utilizes cell counting methods in their daily operating procedures the cell number was additionally determined using flow cytometry. The predicted CDW were then put in correlation with the cell numbers obtained by flow cytometry. The resulting linear correlation can be seen in figure 3b and was used to calculate the cells/mL in figure 3c. The quality fit proved high enough to be utilized for the calculation of CDW in the broth.
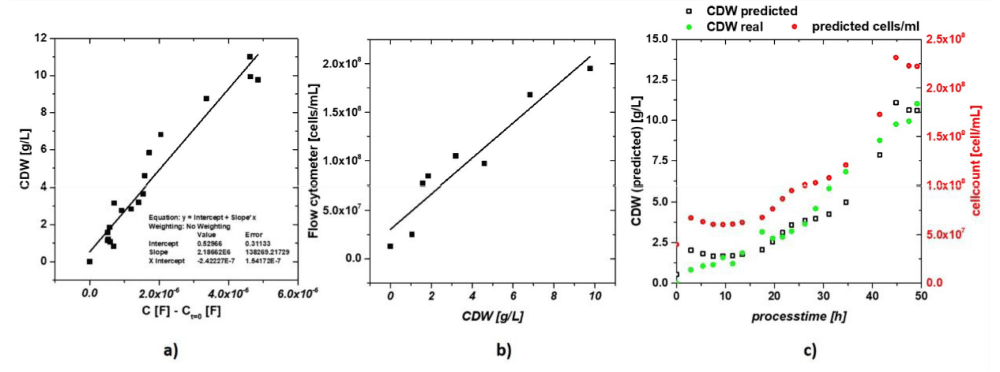
Figure 3: (a) Capacitance signal subtracted by the signal at t = 0 to compensate for long time.
Industrial scale propagation at the stiegl brewery
After successful completion of our proof of principle of first stage at the laboratory scale the impedance measurement technique was applied to the 1500L propagation reactor at the Stiegl brewery. In order to maintain the sterility requirements, the broth was sampled and then circulated inside a custom-built measurement apparatus by Gruber GmbH (Salzburg, Austria). The temperature inside the measurement system was set to 8 °C. An alteration that had to be considered was the fact that for the laboratory scale setup an ideally stirred reactor was used whereas in the industrial setup stirring was provided through alternating pumping of the cells and aeration of the system, which could lead to differences in the metabolic states. The results for the impedance measurement can be seen in figure 4. The cell numbers were determined as usual by the Stiegl in-house methods and set in correlation with the impedance signal. The correlation was again linear. However, a deviation can be seen compared to the laboratory scale. This can be attributed to differences occurring between cell counting via flow cytometry and cell chambers. This has also previously been reported in literature. In order to obtain a viable and exact determination of cell numbers, calibration with the method of choice is crucial. Due to the high quality of correlation, this method provides a straight forward and reliable method to analyze the propagation broth at an industrial scale setup. Furthermore, this straightforward measurement principle based on α-dispersion, provides a reliable new method which can be easily adapted to other applications in the food industry without risking sterility of the system.
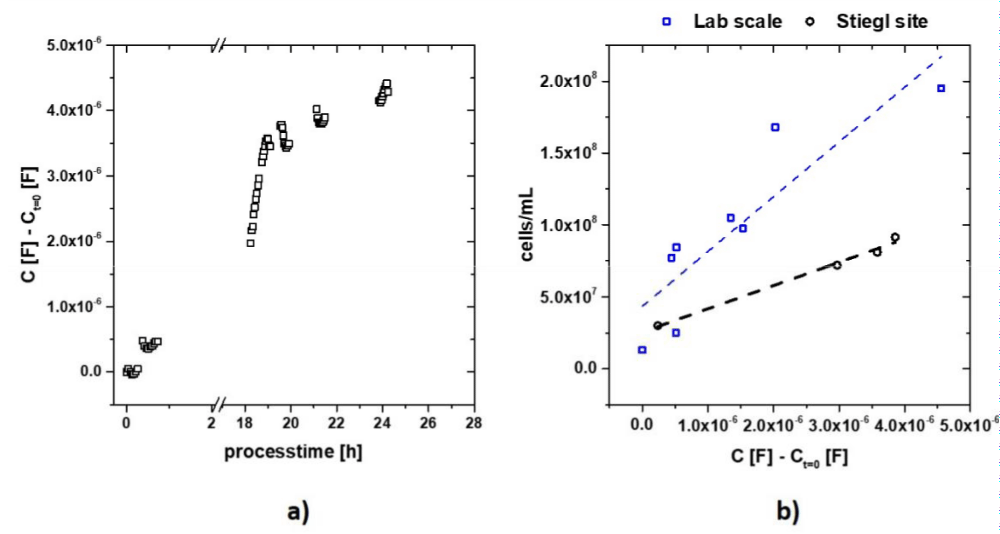
Figure 4: (a) Raw capacitance signal of the samples taken from the propagation reactor at Stiegl brewery; (b) correlation of impedance signal to cell number measured by flow cytometry of the lab scale (blocks) and at the Stiegl site (circles).
Within this case study a novel online probe which is based on EIS at low frequencies for the determination of VCCs for S. cerevisiae was tested. The first stage testing at lab-scale proved promising and was hence transferred to a large-scale industrial setup at the Stiegl brewery in Salzburg. The impedance measurement in the α-dispersion regime was successfully applied to an industrial setup, providing valuable data without exposing any risk to the sterility of the system. The obtained correlation between the cell counting at the brewery and the received impedance signal provides a valuable tool and can from now onwards be used directly to determine the cell numbers during the propagation. Due to these promising results this type of measurement can also be applied to other food industry sectors. Future work will include the development of a working inline probe for large scale applications.
This work was supported by the Austrian Promotion Agency (FFG) [grant number: 874206]. For funding. We thank Stiegl brewery Salzburg/Austria for the opportunity to test the system for the feasibility approach.
Author contributions
Prof. G.C. Brunauer and DDr. C. Slouka conducted the experiments. Prof. G.C. Brunauer and A. Gruber built the measurement setup and DDr. C. Slouka conducted data analysis. Dr. A. Meindl gave valuable input in conceptualization. Prof. G.C. Brunauer and Dr. A. Meindl drafted the manuscript. B. Rotter gave valuable input in designing the electrochemical impedance spectroscopy (EIS) measurement setup. All authors have read and agreed to the published version of the manuscript.
- Gavrilescu M, Chisti, Y. Biotechnology—A sustainable alternative for chemical industry. Biotechnol Adv. 2005; 23: 471-499. PubMed: https://pubmed.ncbi.nlm.nih.gov/15919172/
- Clarke D, Blake-Coleman B, Carr R, Calder M, Atkinson T. Monitoring reactor biomass. Trends Biotechnol. 1986; 4: 173.
- Kiviharju K, Salonen K, Moilanen U, Eerikäinen T. Biomass measurement online: The performance of in situ measurements and software sensors. J Ind Microbiol Biotechnol. 2008; 35: 657. PubMed: https://pubmed.ncbi.nlm.nih.gov/18392869/
- Gonzalez J, Santana AF, Mirza-Rosca J. Effect of bacterial biofilm on 316 SS corrosion in natural seawater by EIS. Corros Sci. 1998; 40: 2141.
- Fleig J. The grain boundary impedance of random microstructures: Numerical simulations and implications for the analysis of experimental data. Solid State Ion. 2002; 150: 181.
- Slouka C, Wurm DJ, Brunauer G, Welzl-Wachter A, Spadiut O, et al. A Novel Application for Low Frequency Electrochemical Impedance Spectroscopy as an Online Process Monitoring Tool for Viable Cell Concentrations. Sensors. 2016; 16: 1900. PubMed: https://pubmed.ncbi.nlm.nih.gov/27845720/
- Lodolo EJ, Kock JL, Axcell BC, Brooks M. The yeast Saccharomyces cerevisiae–the main charactebeer brewing. FEMS Yeast Res. 2008; 8: 1018-1036. PubMed: https://pubmed.ncbi.nlm.nih.gov/18795959/
- Brunauer G, Spadiut O, Gruber A, Slouka C. Yeast Propagation Control: Low Frequency Electrochemical Impedance Spectroscopy as an Alternative for Cell Counting Chambers in Brewery Applications. Chemosensors. 2020; 8: 27.
- Kim YH, Park JS, Jung HI. An impedimetric biosensor for real-time monitoring of bacterial growth in a microbial fermentor. Sens. Actuators B Chem. 2009; 138: 270.
- Slouka C, Brunauer G, Kopp J, Strahammer M, Fricke J, et al. Low-Frequency Electrochemical Impedance Spectroscopy as a Monitoring Tool for Yeast Growth in Industrial Brewing Processes. Chemosensors. 2017; 5: 24.
- Gavrilescu M, Chisti Y. Biotechnology—A sustainable alternative for chemical industry. Biotechnol Adv. 2005; 23: 471–499. PubMed: https://pubmed.ncbi.nlm.nih.gov/15919172/
- Soares C, Machado JT, Lopes AM, Vieira E, Delerue-Matos C. Electrochemical impedance spectroscopy characterization of beverages. Food Che. 2020; 302; 125345.
- Shi F, Gan L, Wang Y, Wang P. Impedimetric biosensor fabricated with affinity peptides for sensitive detection of Escherichia coli O157: H7. Biotechnol Lett. 2020; 42: 825-832. PubMed: https://pubmed.ncbi.nlm.nih.gov/31993846/
- El-Azazy M. Electrochemical Impedance Spectroscopy (EIS) in Food, Water, and Drug Analyses: Recent Advances and Applications. Electrochemical Impedance Spectroscopy. 2020.