
More Information
Submitted: April 23, 2022 | Approved: May 02, 2022 | Published: May 03, 2022
How to cite this article: Gugole Ottaviano F, Arce S, Sosa M. Willingness to pay and sensory acceptability for minimally processed vegetables: behavior of consumers with different household incomes. Arch Food Nutr Sci. 2022; 6: 016-025.
DOI: 10.29328/journal.afns.1001033
Copyright License: © 2022 Gugole Ottaviano F, et al. This is an open access article distributed under the Creative Commons Attribution License, which permits unrestricted use, distribution, and reproduction in any medium, provided the original work is properly cited.
Keywords: Raw vegetables; Cooked vegetables; Second-price auctions

Willingness to pay and sensory acceptability for minimally processed vegetables: behavior of consumers with different household incomes
Fernanda Gugole Ottaviano1* , Soledad Arce1 and Miriam Sosa2
1Comisión de Investigaciones Científicas de La Plata (CIC), Buenos Aires, Argentina
2Consejo Nacional de Investigaciones Científicas y Técnicas (CONICET), Argentina
*Address for Correspondence: Fernanda Gugole Ottaviano, Instituto Superior Experimental de Tecnología Alimentaria (ISETA), 9 de Julio, 6500, Buenos Aires, Argentina, Email: [email protected]
Willingness to pay (WTP) and sensory acceptability for minimally processed (MP) vegetables were studied. A total of 116 participants of two different household incomes (HI) were considered. Two types of preparations (bags with whole vegetables and trays with MP vegetables), and two types of presentations (mix vegetables for soup and mix vegetables for salad), were evaluated. Low income (LI) participants offered more money in general than the medium-high income (MI) participants. However, the offers of the two preparations (soup and salad) did not show significant differences. The 4 samples (two preparations: soup and salad; and two presentations: bags and trays) had good sensory acceptability with values between 6.5 and 8.3, on a scale of 1-9. MI consumers had higher acceptability for mixed vegetables for soup than for salad vegetables; however, LI participants showed no difference between the types of preparation, observing for both samples (soup and salad) high acceptability. For both HI, Check All That Apply (CATA) questions showed that phrases such as “It is unreliable” and “I distrust how it was prepared” were associated with the trays, while the phrase “It takes time to prepare or cook” was associated with bags.
Because of changes in people’s lifestyles occurred in the last decades, consumers have less time to prepare their meals. Constraints related to time pressure and lack of convenience are frequently reported as reasons for fresh vegetable and fruit consumption to fall below the recommended daily intake. Arce [1] found low overall consumption of vegetables, and practicality was mentioned as a reason for not consuming them.
The lifestyle of modern consumers and their desire for natural products with health benefits have been responsible for the current rise in production and demand for MP fruits and vegetables [2,3].
For MP fruit and vegetables are fresh fruit and vegetables processed to increase their functionality without greatly changing their fresh-like properties [4]. For this type of food, the most used processes are washing, cutting, mixing, and packaging [5]. MP vegetables are marketed as products for direct consumption or for quick culinary preparations. These characteristics mean that the preparation time is no longer an obstacle to incorporating or increasing the proportion of vegetables in the diet. Through this processing, it is possible to obtain a wide variety of processed foods, such as salads, vegetables for soups, vegetables for sandwiches, vegetables for sauces, and vegetables for puree [6].
During recent decades, the industry of ready-to-eat vegetables has grown exponentially worldwide. Nevertheless, the ready-to-eat vegetable market in Argentina is still being developed, and their products are mostly demanded in highly populated cities where time for preparing and cooking food is being continuously reduced [7] and is mostly characterized by artisan-type manufacturing processes and little implementation of technology and associated quality systems [8,9].
However, fresh fruits and vegetables may be less expensive to eat than MP ones, for some consumers, this price difference may be a small price to pay for the convenience, i.e., the value of longer shelf life, ease of preparation, and greater availability associated with processed forms [10].
The WTP study has taken on various forms in the applied economics literature for some time now [11]. Using discrete choice techniques, stated choice experiments, and experimental auction methods, analysts have also derived estimates of money an individual is willing to pay to obtain a product [12,13].
Experimental auctions are one tool that can be used to create incentives for people to reveal their “true” preferences. In a typical incentive-compatible experimental auction, subjects bid to obtain one or more goods. The highest bidder(s) wins the auction and pays a price that is determined exogenously from the individual(s)’ bid(s). The advantage of using experimental auctions as a marketing research tool is that they create an environment where people have an incentive to truthfully reveal their preferences [14].
The most widely used incentive-compatible value elicitation mechanisms are the Becker, DeGroot, Marschak (BDM) mechanism, Vickrey nth price auctions, and a random nth price auction [14]. For the past half-century, economists have used the Vickrey, second-price auction to learn about consumer WTP [15]. In this methodology, participants submit sealed bids for one or several products, or, more typical in a marketing context, for the possibility of trading a product for one with improved quality (like a conventional product for an organic product) [16].
Some socio-economic features such as age, gender, level of education, household size, and income level, influence the willingness to pay for different foods [17,18]. Govindasamy & Italia [19] showed that younger consumers, regardless of gender, paid higher premiums for organic products. Petljak [20] found that higher monthly household income predicts a greater WTP and a higher price for organic food compared to conventional food.
Combining sensory science and applied economics improves understanding of food choices and consumer behavior. In fact, numerous studies follow such an approach: [21-25]. Among the many areas covered by sensory science, the evaluation of consumer preferences is important. Typically, consumer preferences are measured by the use of hedonic scales. With this scale, word descriptors are used along with numbers that facilitate the interpretation of the mean values of the responses in terms of the degree of like/dislike [26]. This scale is easy to implement and interpret by both respondents and researchers [27].
The aim of the present work was to study the WTP and sensory acceptability for MP vegetables for two types of preparation, taking into account two HI.
The organization and development of the trial were carried out throughout 2018 and at the beginning of 2019.
Subjects
A total of 116 participants, aged between 25 and 60 years, from 9 de Julio (a city with 47.733 inhabitants located 250 km west of Buenos Aires city) were recruited. Government agencies provided food aid to subjects from the LI group, although they were not affected by famine or extreme hunger. Argentinians, as a rule, do not like to reveal their incomes. In the town of 9 de Julio, Buenos Aires, families that send their children to private schools were considered MI. Alternatively, families whose children have lunch in public school dining rooms or who receive food aid were considered LI. This criterion adopted by Hough & Ferraris [28] was also used in this work. The recruitment was made by a notification delivered to the children of different schools inviting their mothers to complete a survey that consisted of a list of vegetables in which they had to mark their frequency of consumption. Homemakers who marked the vegetables of interest for this trial, with a frequency of consumption of more than once a month, were recruited.
The study was approved by the Instituto Superior Experimental de Tecnología Alimentaria (ISETA) and consent was obtained from each subject before their participation in the study.
Samples
Before selecting the product to be evaluated, a survey was conducted to determine which MP vegetables were sold, as well as their respective weights and prices. The survey was carried out in 10 markets in two different areas of the city. The town center and its surroundings comprise approximately 1.7 km2 and are inhabited the vast majority by MI families. Five markets were chosen from this area of the city. In the outskirts of the city of 9 de Julio, government-funded housing plans have been built for the LI population who pay little or nothing for their houses or apartments. Many of them receive other government aid in the form of food and/or medicine. They were LI families. So, 5 markets were chosen from this area.
Based on the results, two types of preparations (bags with whole vegetables and trays with MP vegetables), and two types of presentations (mix vegetables for soup and mix vegetables for salad), were selected:
-Mix whole vegetables for soup (soup bag): presented in a plastic bag of 30 x 40 cm on each side; inside it had pumpkin, courgette, carrot, celery, green onion, leek, and parsley whole. These vegetables need to be washed, peeled, and then cooked for consumption.
-Mix MP vegetables for soup (soup tray): presented in a 22 x 18 x 1.5 cm Styrofoam tray covered with a film; inside it had all the above-mentioned vegetables (soup bag) but these were washed, peeled, and chopped where the consumer only must cook them to eat them.
-Mix whole vegetables for salad (salad bag): presented in a plastic bag of 30 x 40 cm on each side; inside it had carrots and beets whole. These vegetables need to be washed, peeled, and grated to be eaten as a salad.
-Mix MP vegetables for salad (salad tray): presented in a 22 x 18 x 1.5 cm Styrofoam tray covered with a film; inside it had all the above-mentioned vegetables (salad bag) but these were washed, peeled, and grated. This presentation was ready to eat.
The vegetables were purchased by unit/weight at a market and then processed (washed, peeled, cut/grated, and packaged) at the institute. This was carried out by the researchers. The weight of vegetables in the bags was the same as that of the vegetables in the trays; this was approximately 250 g.
Auction: experimental procedure
Six groups of 8–10 people from each HI were formed to conduct the trial.
Second-price auctions remain widely used because of their incentive-compatible properties and ease of implementation, including the identification of a single winner [15,29,30]. Preferences for a new product are determined by comparing bids for new good to bids for a pre-existing substitute or by directly eliciting bids to exchange a pre-existing substitute for a new good [14].
In this study, we evaluated the WTP for exchanging a bag with vegetables for a tray with MP vegetables.
In experimental auctions, one or more bidding rounds can be conducted. Each auction consisting of several bidding rounds allows participants to update their bids to reflect market prices or new information [31]. In theory, a single-shot Vickrey auction should cause participants to reveal their true value [32], therefore, only one round of bids was made per tray presented.
Before starting the trial, each participant was given a form to be completed with her consent to this study and another form to be completed with her socio-demographic data.
Then, each participant was given a sheet with a detailed explanation of the methodology. Besides, to familiarize subjects with the auction mechanism, a preliminary practice auction was conducted with “alfajor” (defined as a product obtained by joining two or more layers of cookies or cake with filling, usually dulce de leche (caramel jam)), covered or enrobed with various confectionery coatings, chocolate being the most usual [33]. Participants had to write “what was the maximum value that they were willing to pay to exchange their single- alfajor (two layers) for a triple- alfajor (three layers)”. Each consumer had, fictitiously (considering that this stage was training) $30 (AR$) to make the offer. It was, furthermore, informed that its offer was private information and should not be shared with the other participants. The bids were then collected, and ordered on a board from highest to lowest, along with the identification numbers. It was indicated that the “buyer” of the triple alfajor would be the one who made the highest bid, but would have to pay the value of the second-highest price offered.
Once the training auction was over and all the participants said they understood the methodology, two experimental auctions were held. Considering that the trial was conducted in an educational institution, the money was replaced by a purchased ticket, which they could use in a greengrocer’s shop in the city. That is, each participant was given a ticket for the value of $90 for each auction, and it was the maximum value they could bid for each auctioned tray.
The auction was held to evaluate the WTP for exchanging a bag of whole vegetables for a tray of MP vegetables as follows:
1º Test: consumers received a soup bag that needed to be washed, peeled, chopped, and then cooked for consumption and had to write down how much they were willing to pay to exchange that bag for a tray for soup, which only needed to be cooked for consumption.
In both auctions, the “buyer” of the tray was the one who made the highest bid but had to pay the value of the second-highest price offered. The participants, who did not “buy” the auctioned product, received the ticket and two bags of vegetables as a gift.
The order of presentation of the two trays in the auctions was balanced. That is, half of the subjects in each HI received the soup option first presentation order and salad option on the second presentation order; inversely for the other half of the subjects
Sensory acceptability
After the auctions, subjects measured the acceptability of the 4 samples: soup bag, soup tray, salad bag, and salad tray. They were instructed to express their sensory perceptions about the samples using a 9-point structured hedonic scale, with 1 being ‘‘I do not like’’, 5 ‘indifferent’ and 9 ‘I like’.
CATA question
CATA methodology was also used to inquire about influential reasons for the consumption of 4 samples (soup bag, soup tray, salad bag, and salad tray).
For the generating CATA terms, 2 focus groups were conducted with 24 women (housewives) aged between 25 and 65 years. Of this total, half corresponded to LI women and the other half to MI women. In both groups, the purchase/consumption intention of MP vegetables was discussed. The phrases or terms that were named most frequently in the discussion were included in the CATA methodology.
In the CATA questions, each participant had to select all the influential consumption reasons in the 4 samples.
It should be clarified that in all three methodologies used (auction, acceptability, and CATA), participants evaluated the vegetables in bags and trays without testing any preparation.
Data analysis
The socio-demographic data of the participants were counted and their percentages were taken.
Auction: In the first instance, bids made for each preparation (soup and salad) were accounted for and presented as percentages.
WTP was analyzed by analysis of variance (ANOVA) considering HI and soup and salad trays as fixed effects, and subjects as a random effects. Subjects were nested within HI. P ≤ 0.05 was considered significant. Means were compared using Fisher’s least significant difference (LSD) at a 5% significance level.
To identify groups of consumers with similar offered patterns, subjects were clustered using Ward’s hierarchical clustering technique with Euclidean distances[34].
Sensory acceptability: Sensory acceptability was analyzed by ANOVA, considering HI, preparation, and presentation as fixed effects, and subject as a random effect. Subjects were nested within HI.
In order to identify groups of consumers with similar acceptability patterns, subjects were clustered using Ward’s hierarchical clustering technique with Euclidean distances [34].
CATA question: A Correspondence Analysis (CA) was performed in the frequency table that contains the answers to the CATA question, with two categorical variables: samples (presentation y preparation) and terms (consumption reasons). The analysis was carried out for each HI separately.
All statistical analyses were performed using Genstat (VSN International Ltd., Hempstead, United Kingdom).
The profile of consumers who consumed the vegetables selected for the trials with a consumption frequency greater than once a month is shown in Table 1.
| Table 1: Demographic characteristics of the consumers. | ||
| HI (%) | LI (%) | |
| n = 58 | n = 58 | |
| Age | ||
| 20-35 | 36,2 | 28,1 |
| 35-45 | 27,6 | 26,3 |
| 45-55 | 29,3 | 35,1 |
| More than 60 | 6,9 | 10,5 |
| Studies achieved | ||
| No studies | 0,0 | 3,5 |
| Incomplete primary | 1,7 | 12,3 |
| Complete primary | 3,4 | 31,6 |
| Incomplete secondary | 10,3 | 14,0 |
| Complete secondary | 15,5 | 19,3 |
| Incomplete tertiary | 17,2 | 5,3 |
| Complete tertiary | 29,3 | 5,3 |
| Incomplete university | 10,3 | 3,5 |
| Complete university | 10,3 | 5,3 |
| Postgraduate (Master's, Ph.D., or equivalents) | 5,2 | 0,0 |
| Occupation | ||
| Employee | 58,6 | 38,6 |
| Housewife | 27,6 | 47,4 |
| Retired / Pensionared | 3,4 | 3,5 |
| Student | 17,2 | 7,0 |
| Unemployed | 3,4 | 0,0 |
| Unable to work | 3,4 | 1,8 |
| Other | 6,9 | 1,8 |
| Number of members in the family | ||
| 1 | 6,9 | 0,0 |
| 2 | 19,0 | 15,8 |
| 3 | 27,6 | 22,8 |
| 4 | 31,0 | 17,5 |
| 5 | 8,6 | 19,3 |
| More than 5 | 6,9 | 24,6 |
Auction
Each participant had $90 to bid and was thus able to exchange the bag (for each preparation) for the tray. Considering the participants who offered more than half of the money available (more than $45), it was observed that:
- for the salad tray, 62% of LI offered more than the participants of MI (43%).
- for the soup tray, offers in both HI were similar (67% LI and 60% MI).
In turn, 21% and 26% of LI participants bid the total money available ($90) for the salad tray and the soup tray, respectively. This percentage was lower in MI, only 5% for the salad tray and 16% for the soup tray.
The opposite, with the percentage of participants who decided not to make an offer and kept the bag in its 2 preparations (soup and salad), also was observed. The 21% and 14% of MI participants bid $0 for salad and soup trays, respectively. Only 5% and 9% of LI participants did not bid on salad and soup trays, respectively.
MI participants bid, on average, $41 and $49 to get the salad tray and the soup tray, respectively. While the offers from LI participants were similar for both preparations, being $55 for the salad tray and $57 for the soup tray.
ANOVA results showed differences between the offers of the two HI, where it was observed that the LI offered more money in general than the MI (Figure 1). However, the offers of the two preparations (soup and salad) did not show significant differences. The preparation*HI interaction was also not significant.
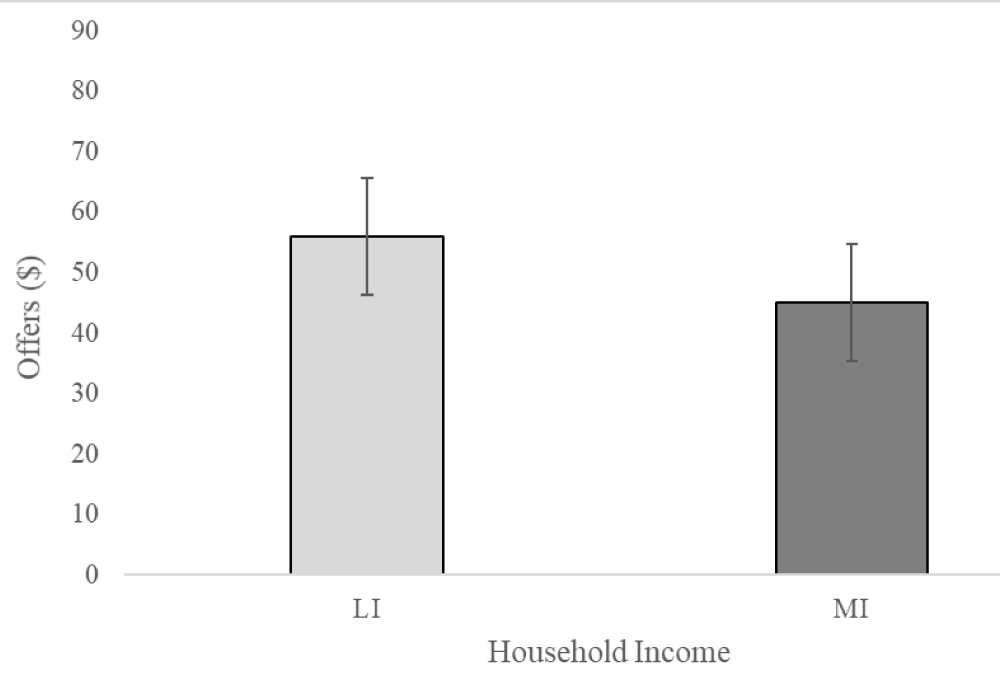
Figure 1: Offers mean ($) made by the participants of LI and MI, for both trays.
An agglomerative hierarchical cluster analysis was carried out to identify segments of consumers that have similar offering patterns in 2 samples (salad and soup trays). Four clusters were identified: Cluster 1 (n = 32), Cluster 2 (n = 20), Cluster 3 (n = 37), and Cluster 4 (n = 27) (Figure 2). Cluster 1 made a high bid ($83 approximately) on both samples. A high offer ($73) for the soup tray and a medium bid (about half the money available to bid, $53) for the salad tray was observed in Cluster 2. In cluster 3 was observed that in both samples consumers approximately offered half of the money available ($46 for the soup tray and $37 for the salad tray). Cluster 4 offered a low bid for 2 samples.
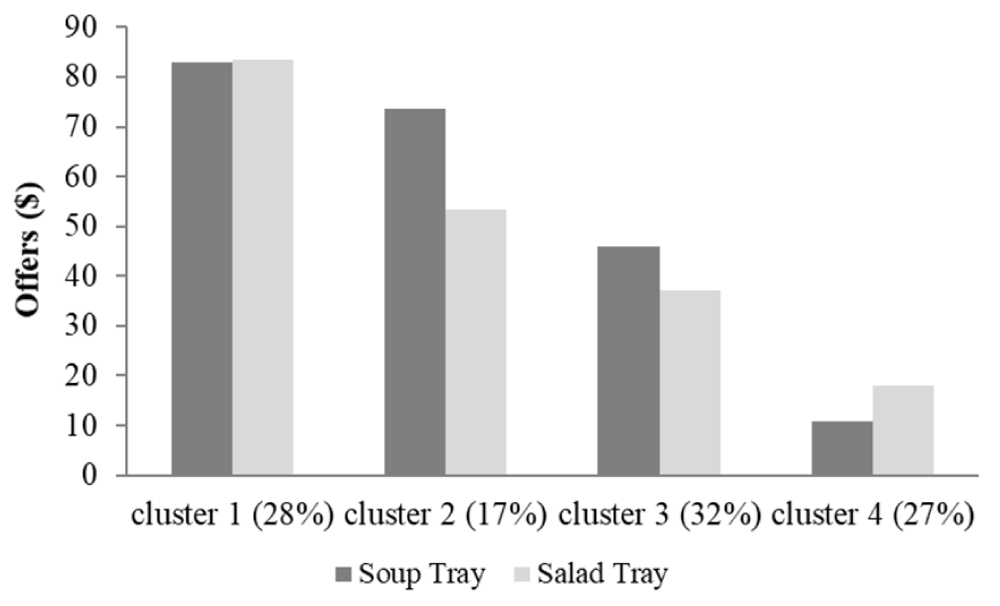
Figure 2: Cluster analysis based on bid patterns for soup and salad trays. The percentage of subjects in each cluster is shown in parenthesis.
Considering the number of subjects in each cluster according to their HI; it was observed that the HI factor had an incidence on bid patterns only in cluster 1 (composed of more LI consumers); in the rest of the groups, a similar number of LI consumers and MI consumers was observed. This behavior was also observed when the educational level of the consumers who formed each group was taken into account; where the same cluster consisted of more consumers of low educational level.
Sensory acceptability
The 4 samples had good sensory acceptability with values between 6.5 and 8.3, on a scale of 1-9.
ANOVA results showed that the three main effects (preparation, presentation, and HI) were significant. The soup had greater acceptability than the salad preparations. While bag gave higher acceptability values than the tray presentations. LI gave higher acceptability values than the MI. The 2-way Presentation*Preparation interaction was significant (Figure 3), with higher scores for soup bag, however, mixed vegetables for salad showed no difference between the types of presentation (bag/tray).
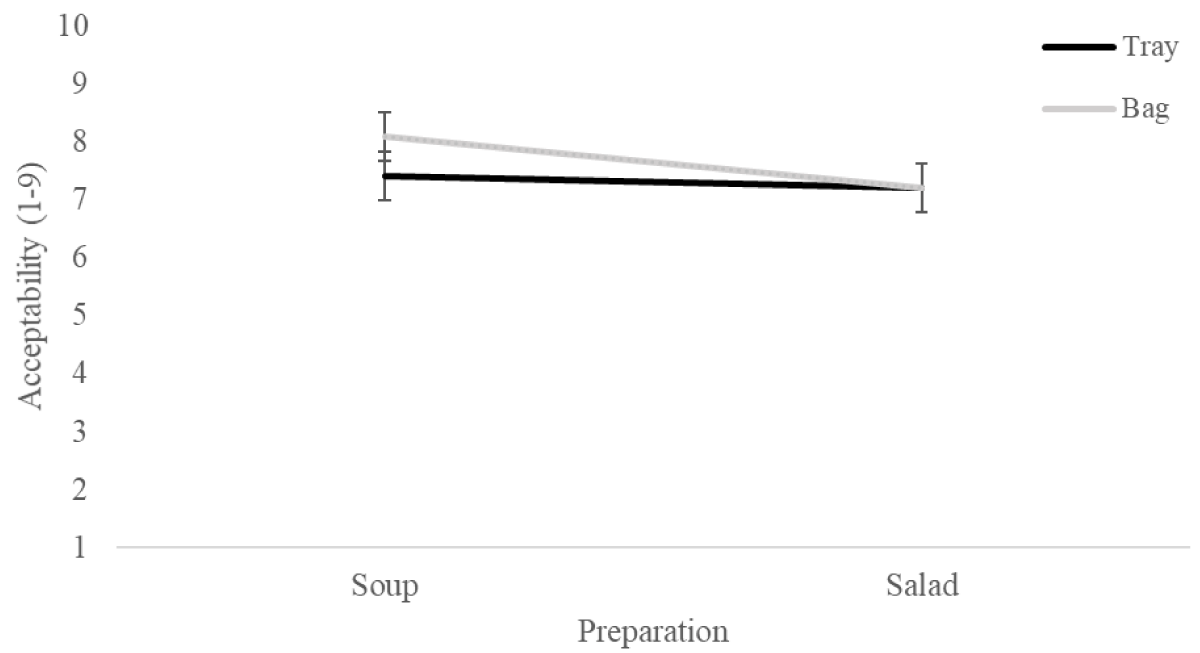
Figure 3: Sensory acceptability (mean) for LI and MI, using a 9-point hedonic scale, when Presentation*Preparation was evaluated.
The 2-way Preparation*HI interaction was also significant. MI had higher acceptability for mixed vegetables for soup than for mixed vegetables for salad; however, LI participants showed no difference between the type of preparation, observing both, soup and salad, high acceptability (Figure 4).
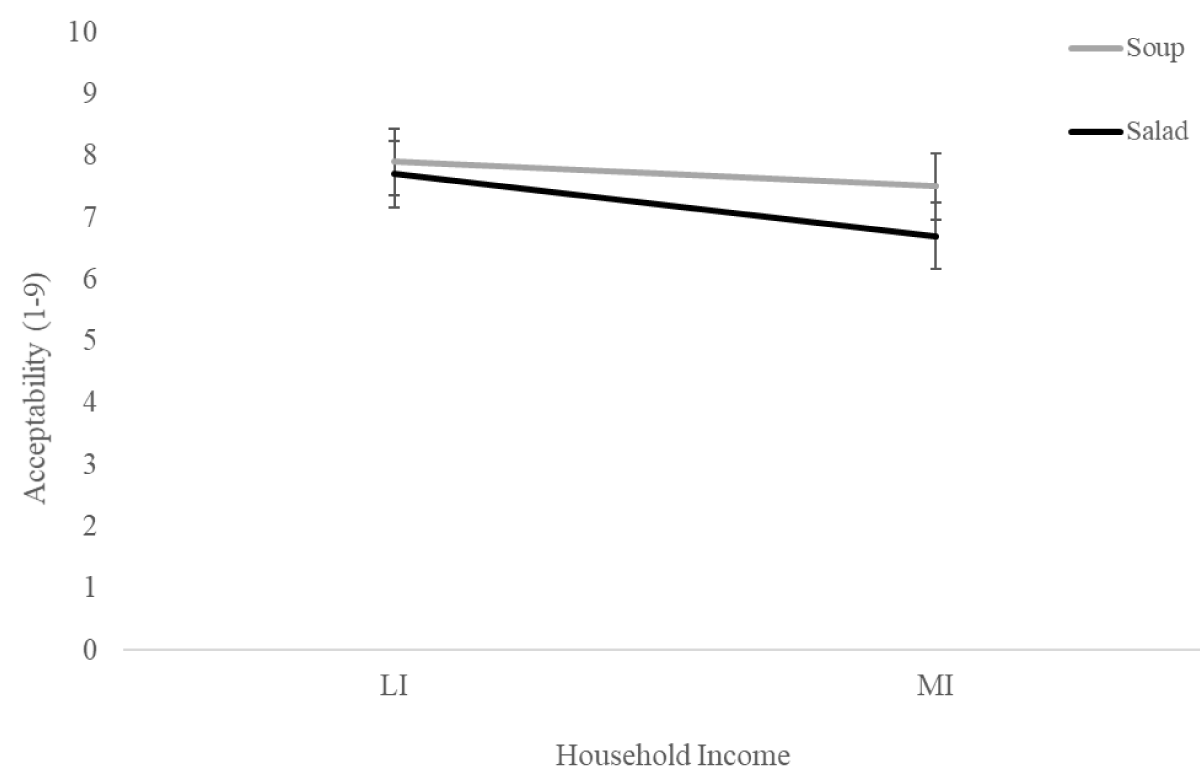
Figure 4: Sensory acceptability (mean) for LI and MI, using a 9-point hedonic scale, when Presentation*HI was evaluated.
The 2-way Presentation*HI and the 3-way interaction Preparation*Presentation*HI were not significant.
An agglomerative hierarchical cluster analysis was carried out to identify segments of consumers that have similar acceptability patterns in 4 samples. Four clusters were identified: Cluster 1 (n = 11), Cluster 2 (n = 21), Cluster 3 (n = 21), and Cluster 4 (n = 63) (Figure 5). Cluster 1 gave low acceptability (average values less than 4 on a scale of 1 to 9) to samples presented on a tray (mix vegetables for soup and for salad), while high acceptability (average values greater than 8) was given to the bags in their 2 preparations. Medium-high acceptability (average values greater than 5.2) was observed in the 4 samples in Cluster 2. The same behavior was observed in Cluster 3, except for the salad bag, which had low acceptability (average = 3.4). Cluster 4, which represents more than half of the consumers, presented high acceptability for the 4 samples.
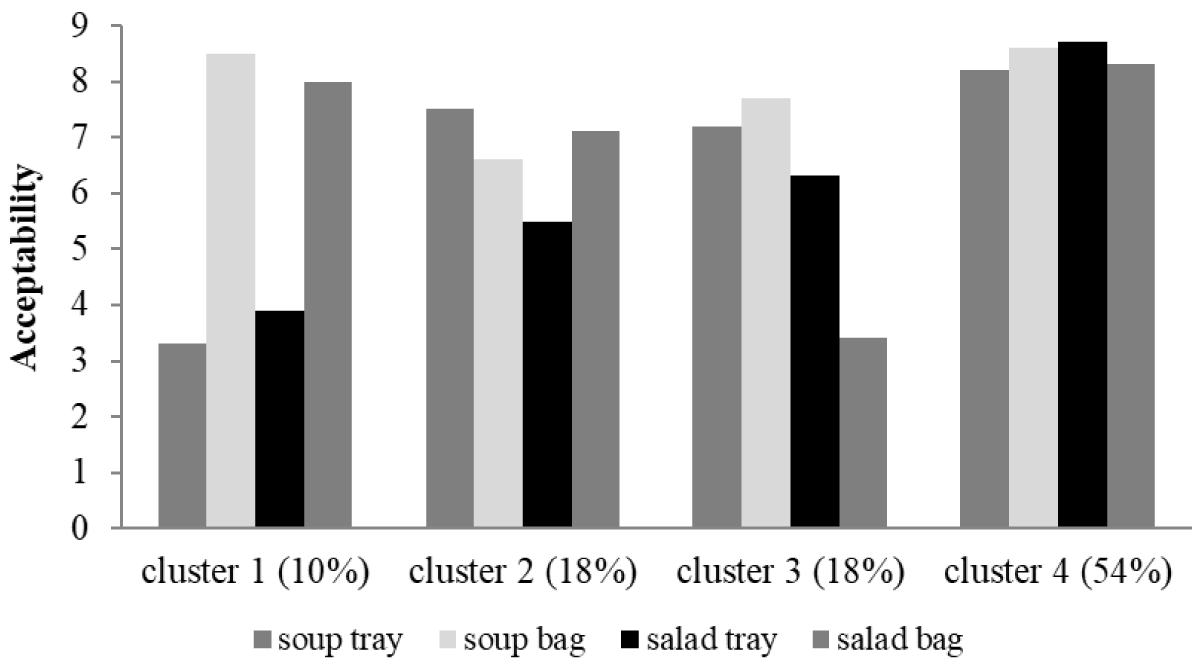
Figure 5: Cluster analysis based on acceptability patterns for soup and salad trays. The percentage of subjects in each cluster is shown in parenthesis.
Considering the number of subjects in each cluster according to their HI, the number of children in the family, and educational level; it was observed that these factors had an incidence on acceptability patterns only in cluster 4. This cluster, where the consumers presented high acceptability for the 4 samples, was composed of more LI consumers, consumers who have 4 or more children in their family, and consumers who have a low educational level.
CATA
The views that emerged in the 2 focus groups, 22 phrases or reasons (these phrases are detailed in Figures 6 and 7) relating to the purchase/consumption trays with MP vegetables were repeated more frequently in both focus groups, which were used in the CATA methodology.
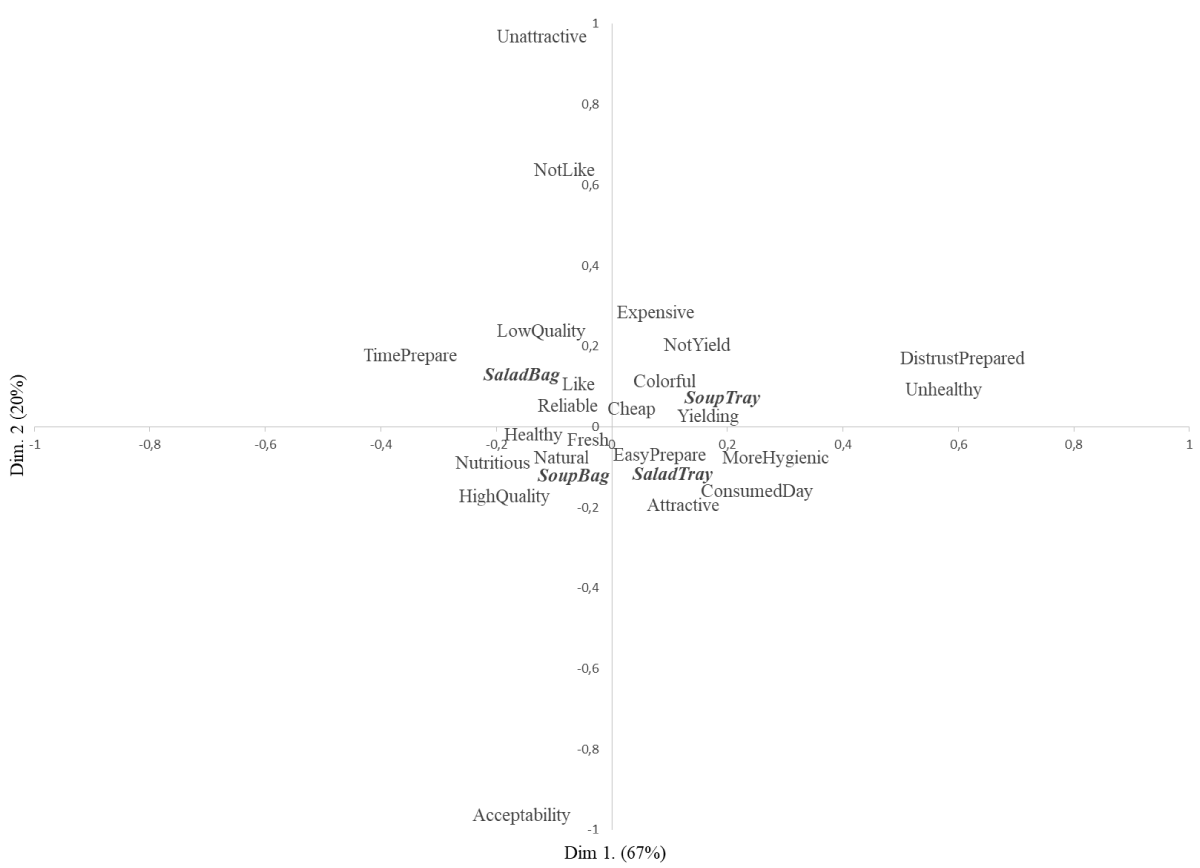
Figure 6: Biplot representation of the four samples (soup bag, soup tray, salad bag, salad tray) and the reasons for consumption of LI participants, considering overall liking scores as supplementary variables. Reference: It is low quality (low quality), It is cheap (Cheap), It is high quality (HighQuality), It is expensive (Expensive), It is colorful (Colorful), It is easy to prepare or cook (EasyPrepare), Fresh (Fresh), It takes time to prepare or cook (TimePrepare), It is more hygienic (MoreHygienic), I like it (Like), I distrust how it was prepared (DistrustPrepared), It is very attractive (Attractive), It is reliable (Reliable), It is natural (Natural), I do not like it (not like), It does not yield (NotYield), It is nutritious (Nutritious), It is unattractive (Unattractive), It is unhealthy (Unhealthy), It yielding (Yielding), It is healthy (Healthy), It is to be consumed in the day (ConsumedDay).
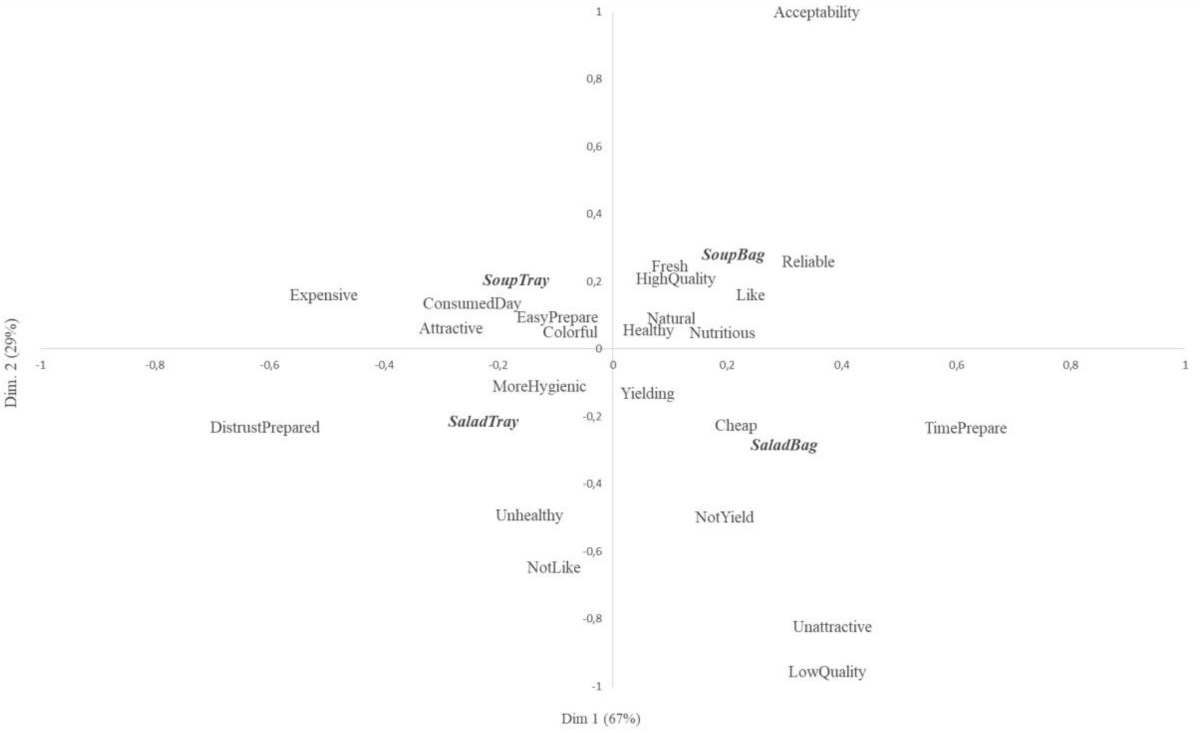
Figure 7: Biplot representation of the four samples (soup bag, soup tray, salad bag, salad tray) and the reasons for consumption of MI participants, considering overall liking scores as supplementary variables. Reference: It is low quality (low quality), It is cheap (Cheap), It is high quality (HighQuality), It is expensive (Expensive), It is colorful (Colorful), It is easy to prepare or cook (EasyPrepare), Fresh (Fresh), It takes time to prepare or cook (TimePrepare), It is more hygienic (MoreHygienic), I like it (Like), I distrust how it was prepared (DistrustPrepared), It is very attractive (Attractive), It is reliable (Reliable), It is natural (Natural), I do not like it (not like), It does not yield (NotYield), It is nutritious (Nutritious), It is unattractive (Unattractive), It is unhealthy (Unhealthy), It yielding (Yielding), It is healthy (Healthy), It is to be consumed in the day (Consumed Day).
Figure 6 presents CA maps for LI, where dimensions 1 and 2 represented 67% and 20% of the variation of the experimental data, respectively. In this figure, the 4 samples were different and each of them appeared in each quadrant of the graph. Acceptability was associated with the soup bag. In turn, this was associated with the phrases “It is a high quality”, “It is healthy”, “Fresh”, “It is natural”, and “It is nutritious”. Salad bag was associated with the terms: “I like it”, “It takes time to prepare or cook”, “It is reliable” and “It is low quality”. Soup tray was related to the terms “It yielding” and “It is colorful”. The salad tray was associated with the phrases: “It is more hygienic”, “It is easy to prepare or cook”, “It is to be consumed during the day” and “It is very attractive”. On the other hand, phrases such as “It is unhealthy” and “I distrust how it was prepared” were associated with the trays, while the phrase “It takes time to prepare or cook” was associated with bags.
Figure 7 presents CA maps for MI, where dimensions 1 represented 67% of the variation in the experimental data and dimension 2, the 29%. As was shown in LI, the 4 samples were different and each of them appeared in each quadrant of the graph. The acceptability was also associated with soup bag, and it was more related to “It is reliable”, “Fresh”, “I like it” and “It is a high quality”. While salad bag was more related to the terms, “It is cheap” and “It does not yield”. Soup tray was associated with the terms: “It is to be consumed during the day”, “It is easy to prepare or cook”, “It is colorful” and “It is very attractive”. The salad tray was associated with the phrase: “It is more hygienic” and to a lesser degree “It is unhealthy”.
However, phrases such as “It is expensive” and “I distrust how it was prepared” were associated with the trays. As expected, the term “It takes time to prepare or cook” was associated with bags, and the phrase “It is easy to prepare or cook” was associated with trays.
The success of new food technologies depends on consumers’ responses [35]. The production chain of MP vegetables is characterized by the strong influence of the final consumer. As with other segments of agribusiness, the desire and requests of buyers must always be considered [36]. The present study combines disciplines, such as applied economics and sensory science to improve the understanding of food choice behavior.
Empirical results on the effect of income on consumer WTP for safe foods appear to be mixed too. Since consumer WTP for food safety is negatively correlated with the marginal utility of money, consumer WTP is expected to increase as the income of the consumer increases [37]. Other studies did not find income as a significant determinant of consumer WTP for organic food products [38,39]. Gil & Soler [40] found that among the socio-economic variables, income level did not have any significant effect on the premium participants were willing to pay. However, even though the effect was not significant, it is interesting to note that the poorest were willing to pay a higher premium for organic olive oil. Similar results were found in our study, where it was observed that LI participants offered more to exchange bags for trays. This could be because LI consumers perceived MP vegetables (tray samples) as novelty products and were willing to pay more to obtain them. This result was consistent with those found in Shogren [41], who indicated that it is the novelty of the product and not the novelty of the procedure (experimental auction) that can bias bids upwards.
Studies such as consumer behavior, acceptability, and the frequency of consumption directed at fresh vegetables have been widely studied [42-46]. However, there are few studies on MP vegetables, and of those that exist, the majority have a focus on microbiological quality, safety, processing, packaging issues, and consumer behavior [47-53]. It is important to highlight that consumer perception was investigated in these studies, but sensory acceptability was not mentioned.
In our study, the sensory acceptability of four samples (soup and salad trays and soup and salad bag) was measured. All samples had good sensory acceptability; although the whole vegetables in the bag were the ones with the highest sensory acceptability. Nunes [54] found similar results when comparing the sensory acceptability of MP and irradiated arugula.
As in the offers made in the auction, LI generally presented higher values of acceptability than MI respondents. In contrast, Arce [1] found no significant differences between LI and MI consumers. These authors measured the sensory acceptability of 27 vegetables.
Considering the reasons related to the purchase/consumption in each HI, it was observed that the MI participants could characterize each sample more markedly than LI. This is observed in the maps (Figures 6 and 7), where, for example, the LI participants, although they characterized each sample, were located close to the intersection of the axes. This could be due because a phrase or reason for purchase/consumption having the same influence for the 4 samples, for this group of participants. Despite this, they agreed on some phrases that characterized the MP vegetables and the reasons related to the purchase/consumption. Participants of both HI associated the two trays with the phrases “I distrust how it was prepared”. Consumers do not actively look for products produced by new technologies, but look for certain attributes of a product. Regardless of enhanced food properties, food produced by new technology may create concern and uncertainty if the public perceives any risk[55]. The fresh-cut sector is constantly evolving and innovating to enhance product quality and safety attributes that are generally valued by consumers [56,57]. Cardello [58] studied consumers’ risk perception associated with innovative food preservation technology, and found a negative utility towards MP products, implying that not sufficiently processed products are perceived as a source of microbiological or other safety risks. On reviewing the literature, it emerges that fruit and vegetable attributes connected to safety could be the most important in orienting consumers’ choices [57].
Another characteristic related to MP vegetables was that “It is easy to prepare or cook”. Other studies have also pointed to convenience as one of the most important motivations for purchasing MP vegetables and ready-to-eat foods [59-62]. Vidal [52] applied three qualitative methodologies and revealed that ready-to-eat salads are perceived as convenience products, that is, they require little or no time and effort for their preparation and consumption, being the main motivation to acquire this type of product. On the other hand, Ares [63] identified motives underlying food choice and barriers to healthy eating among consumers at two socioeconomic levels in Uruguay. Among the food mentioned were fruit and raw vegetables. Observed that Time available for cooking was the main determinant of food selection for MI participants. They indicated that they try minimizing the time spent on food preparations, particularly after all activities of the day, and that in their free time they preferred to do other things rather than cook.
Human health-related aspects, phrases such as Healthy, Nutritious, and Natural, were related to soup bags in both HI. This is in agreement with Arce [1] that those whole vegetables were mainly related to phrases related to health. In addition, Vidal [52] indicated that the term Health was not a category highlighted by consumers for ready-to-eat salads, as in this study. These results also agree with those reported by Ragaert [60].
Although the price factor was not preponderant in consumer decision-making, the MI associated the term “Expensive” with trays and “Cheap” with bags, instead, the LI did not characterize any sample with these phrases and these had few mentions. Similar results were found in Massaglia [64] where price did not emerge as a discriminating factor when exploring the preferences and buying habits of fresh-cut, ready-to-eat salads. Other studies presented different results, Ares [63] found that LI participants rarely purchased ready-to-eat products due to their relatively high cost, compared to raw food ingredients; and Vidal [52] revealed that ready-to-eat salads were perceived as expensive products, with price being a variable that discourages their purchase.
We can conclude that the MI was more critical when evaluating the different methodologies used in this study.
A low percentage of participants offered 0$ to exchange the bags of vegetables for the trays, so MP vegetables are a good option to incorporate or increase the consumption of these foods.
Although practicality was a positive characteristic that they named among the reasons they considered to buy or consume MP vegetables, distrust in the preparation of the product would be an important factor to consider and try to reverse at the time of its marketing.
- The limitation of this research may be the small geographical area included in our study. Further research could be extended to a large metropolitan area to assess potential differences between other Argentinian cities and to compare the behavior in the purchase or consumption of MP vegetables of individuals belonging to them.
The authors acknowledge Dr. Guillermo Hough for his valuable contributions to this study and special thanks to all the participants for their valuable contributions to the study.
Funding: This research received no external funding.
Author contribution: All authors participated in concep-tualization, data curation, formal analysis, methodology, writing original draft preparation, writing; and they have approved the final article.
Conflicts of interest: The authors declare that they have no conflict of interest.
- Arce S, Gugole Ottaviano F, Sosa M. Sensory acceptability, consumption frequency, and factors associated with consumption of fruits and vegetables among low and medium income consumers in Argentina. J Sens Stud. 2020;36(2):1-13. DOI: 10.1111/joss.12632
- Hussein Z, Caleb OJ, Opara UL. Perforation-mediated modified atmosphere packaging of fresh and minimally processed produce—A review. Food Packag. 2015;6:7–20. https://doi.org/10.1016/j.fpsl.2015.08.003.
- Oms-Oliu G, Ma Alejandra Rojas-Graü MA, Laura Alandes González LA, Varela P, Soliva-Fortuny R, Hernando Hernando MI, Pérez Munuera I, Fiszman S, Martín-Belloso O. Recent approaches using chemical treatments to preserve quality of fresh-cut fruit: A review. Postharvest Biol Technol. 2010;57:139–148. doi:10.1016/j.postharvbio.2010.04.001
- Siddiqui MW, Chakraborty I, Ayala-Zavala JF, Dhua RS. Advances in minimal processing of fruits and vegetables: a review. J Sci Ind Res. 2011;70:823-834.
- Ares G, Martínez I, Lareo C, Lema P. Failure criteria based on consumers’ rejection to determine the sensory shelf life of minimally processed lettuce. Postharvest Biol. Technol. 2008, 49(2), 255-259. doi:10.1016/j.postharvbio.2008.02.006
- Parzanese M. Vegetales mínimamente procesados. Alimentos Argentinos, 2012, 55, 31-39.
- Finten G, Garrido JI, Agüero MV, Jagus RJ. Irradiated ready-to-eat spinach leaves: How information influences awareness towards irradiation treatment and consumer's purchase intention. Radiat Phys Chem. 2017;130:247–251. http://dx.doi.org/10.1016/j.radphyschem.2016.09.004
- Wilches R. Hortalizas frescas precortadas en la ciudad de Buenos Aires: estructuras de gobernancia, estrategias y tácticas asociadas. Estudio de casos múltiple. Tesis Magister de la Universidad de Buenos Aires, Área: Agronegocios y Alimentos. Buenos Aires, 2009.
- Sgroppo S, Montiel G. Estado actual del mercado de frutos y vegetales cortados en Argentina. Simposium Estado actual del mercado de frutos y vegetales cortados en Iberoamerica. San José Costa Rica. 2004.
- Reed J, Frazão E, Itskowitz R. How much do Americans pay for fruits and vegetables? Electronic Report from the USDA ERS. Agric Inf Bull. 2004;No.(AIB-790) 39.
- Quagrainie KK. IQF Catfish Retail Pack: A Study of Consumers’ Willingness to Pay. Int Food Agribus Manag Rev. 2006;9(2); 75-87.
- Hoffman E, Menkhaus DJ, Chakravarti D, Field RA, Whipple GD. Using Laboratory Experiment Auctions in Marketing Research: A Case Study of NewPackaging for Fresh Beef. Mark Sci. 1993;12(3);318-338. DOI: 10.1287/mksc.12.3.318
- Loureiro, M.L, Umberger, W.J. Estimating Consumer Willingness-to-Pay for Country-of-Origin Labeling. J. Agric. Resour. Econ. 2002, 28, 287-301.
- Lusk JL, Alexander C, Rousu MC. Designing experimental auctions for marketing research: The effect of values, distributions, and mechanisms on incentives for truthful bidding. Rev Mark Sci. 2007;5(1); DOI: 10.22004/ag.econ.20202
- McFadden JR, Huffman WE. Consumer valuation of information about food safety achieved using biotechnology: Evidence from new potato products. Food Policy. 2017; 69: 82–96. http://dx.doi.org/10.1016/j.foodpol.2017.03.002
- Grunert KG, Juhl HJ, Esbjerg L, Jensen BB, Bech-Larsen T, Brunsø K, Madsen CØ. Comparing methods for measuring consumer willingness to pay for a basic and an improved ready-made soup product. Food Qual Prefer. 2009; 2: 607–619. DOI: 10.1016/j.foodqual.2009.07.006
- Owusu V, Owusu Anifori M. Int Food Agribusiness. Manag Rev. 2013; 16(1): 67-86.
- Hou B, Wu L, Chen X, Zhu D, Ying R, Fu-Sheng T. Consumers’ Willingness to Pay for Foods with Traceability Information: Ex-Ante Quality Assurance or Ex-Post Traceability? Sustainability. 2019;11:1-14. https://doi.org/10.3390/su11051464
- Govindasamy, R, Italia, J. Predicting willingness-to-pay a premium for organically grown fresh produce. J. Food Distrib. Res. 1999;30(2): 44-53. DOI: 10.22004/ag.econ.27385
- Petljak K, Renkoet S, Štulecal I. Consumers` willingness to pay more for organic food in Croatia. Ekonomski Vjesnik/Ekonviews. 2017;30:441-455.
- Gallardo RK, Kupferman E, Colonna, A. Willingness-to-pay for Optimal Anjou Pear Quality. Hor Sci. 2011; 46:452‒456. DOI: 10.21273/HORTSCI.46.3.452
- Zhang H, Gallardo RK, McCluskey J, Kupferman E. Consumers’ Willingness to Pay for Treatment-Induced Quality Attributes in Anjou Pears. J Agr Resour Econ. 2010;35: 105‒117. DOI: 10.22004/ag.econ.61062
- Dinis I, Simoes O, Moreira J. Using sensory experiments to determine consumers’ WTP for traditional apple varieties. Span J Agric Res. 2011;9:351–362. DOI: 10.5424/sjar/20110902-133-10
- Bi X, House L, Gao Z, Gmitter F. Sensory evaluation and experimental auctions: measuring willingness to pay for specific sensory attributes. Am J Agric Econ. 2011; 94:562‒568. DOI: 10.1093/ajae/aar062
- Costanigro M, Kroll S, Thilmany D, Bunning M. Is it love for local/organic or hate for conventional? Asymmetric effects of information and taste on label preferences in an experimental auction. Food Qual Prefer, 2014, 31, 94‒105. http://dx.doi.org/10.1016/j.foodqual.2013.08.008
- Lim J. Hedonic scaling: A review of methods and theory. Food Qual Prefer. 2011;22:733‒747. https://doi.org/10.1016/j.foodqual.2011.05.008
- Gallardo K, Hong YA, Jaimes MS, Orozco JF. Investigating consumer food choice behavior: an application combining sensory evaluation and experimental auctions. Cien Inv Agr. 2018;45:1-10. DOI: 10.7764/rcia.v45i1.1765
- Hough G, Ferraris D. Free listing: A method to gain initial insight of a food category. Food Qual Pref. 2010; 21: 295–301. DOI: 10.1016/j.foodqual.2009.04.001
- Alfnes F. Willingness to Pay versus Expected Consumption Value in Vickrey Auctions for New Experience Goods. Am J Agri Eco. 2007; 89(4):921-931. https://doi.org/10.1111/j.1467-8276.2007.01028.x
- Lusk JL, Roosen J, Fox JA. Demand for Beef from Cattle Administered Growth Hormones or Fed Genetically Modified Corn: A Comparison of Consumers in France, Germany, the United Kingdom, and the United States. Am J. Agric. Econ. 2003, 85, 16–29. https://doi.org/10.1111/1467-8276.00100
- Fox CR, Tversky A. Ambiguity Aversion and Comparative Ignorance. Q J Econ. 1995;110:585–603.
- Fox JA, Hayes DJ, Shogren JF, Kliebenstein JB. Experimental Methods in Consumer Preference Studies. J Food Distrib Res. 1996;2-7.
- Código Alimentario Argentino (CAA). Capítulo IX. Alimentos farináceos – cereales, harinas y derivados (artículo 761bis Resolución conjunta 196/2001 y 1020/2001). 2004.
- Mc Ewan J. Cluster analysis and preference mapping. Review No. 12. Project No. 29742. England: Campden Chorleywood. Food Research Association. 1998.
- Chen Q, Anders S, An H. Measuring consumer resistance to a new food technology: A choice experiment in meat packaging. Food Qual Pref. 2013; 28(2): 419-428. DOI: 10.1016/j.foodqual.2012.10.008
- Da Rosa Lopes M, Pereira FDAR, De Souza CC, Dos Reis Neto JF, Bono JAM. Perception of buyers in regards to the quality and food safety of minimally processed vegetables. Afr J Agric Res. 2015;10(28): 2717-2723.
- Liu Y, Zeng Y, Yu X. Consumer willingness to pay for food safety in Beijing: a case study of food additives. Int J Agric Econ. (IAAE). 2009;2-24. https://doi.org/10.5897/AJAR2015.9737
- Darby K, Batte MT, Ernst S, Roe B. Decomposing local: A conjoint analysis of locally produced foods. Am J Agric Econ. 2008;90(2):476-486. DOI: 10.1111/j.1467-8276.2007.01111.x
- Voon JP, Ngui KS, Agrawal A. Determinants of willingness to purchase organic food: An exploratory study using structural equation modeling. Int Food Agribus Manag Rev. 2011;14(2);103-120.
- Gil JM, Soler F. Knowledge and willingness to pay for organic food in Spain: Evidence from experimental auctions. Acta Agric Scand C. 2006;3(3-4):109-124. https://doi.org/10.1080/16507540601127656
- Shogren JF, List JA, Hayes DJ. Preference Learning in Consecutive Experimental Auctions. Amer J Agr Econ. 2000; 82(4): 1016-1021. https://doi.org/10.1111/0002-9092.00099
- Pearson N, Biddle SJH, Gorely T. Family correlates of fruit and vegetable consumption in children and adolescents: a systematic review. Public Health Nutr. 2009;12(2):267-283. DOI: 10.1017/S1368980008002589
- Alaimo K, Packnett E, Miles RA, Kruger DJ. Fruit and vegetable intake among urban community gardeners. J Nutr Educ Behav. 2008;40(2);94-101. DOI: 10.1016/j.jneb.2006.12.003
- Pollard J, Kirk SFL, Cade JE. Factors affecting food choice in relation to fruit and vegetable intake: a review. Nutr Res Rev. 2002;15(2):373-388.
- Brug J, Debie S, van Assema P, Weijts W. Psychosocial determinants of fruit and vegetable consumption among adults. Results of focus group interviews. Food Qual Prefer. 1995;6(2):99–107.
- Marshall D, Anderson A, Lean M, Foster A. Healthy eating: fruit and vegetables in Scotland. Br Food J. 1994; 96(7): 18–24.
- Foley DM, Dufour A, Rodriguez L, Caporaso F, Prakash A. Reduction of Escherichia coli in shredded iceberg lettuce by chlorination and gamma irradiation. Radiat Phys Chem. 2002;63 (3): 391-396. DOI: 10.1016/S0969-806X(01)00530-8
- Luna Guzmán I, Barrett DM. Comparison of calcium chloride and calcium lactate effectiveness in maintaining shelf stability and quality of fresh-cut cantaloupes. Postharvest Biol Technol. 2000;19(1):61-72. https://doi.org/10.1016/S0925-5214(00)00079-X
- Allende A, Artés F. UV-C radiation as a novel technique for keeping quality of fresh processed ‘lollo rosso’ lettuce. Food Res Int. 2003;36(7): 739-746. DOI: 10.1016/S0963-9969(03)00054-1
- Allende A, McEvoy JL, Luo Y, Artés F, Wang CY. Effectiveness of two-sided UV-C treatments in inhibiting natural microflora and extending the shelf-life of minimally processed ‘red oak leaf’ lettuce. Food Microbiol. 2006;23(3):241-249. doi:10.1016/j.fm.2005.04.009
- De Azeredo GA, Stamford TLM, Nunes PC, Gomes Neto NJ, De Oliveira MEG, De Souza EL. Combined application of essential oils from Origanum vulgare L. and Rosmarinus officinalis L. to inhibit bacteria and autochthonous microflora associated with minimally processed vegetables. Food Res Int. 2011;44(5): 1541-1548. doi: 10.1590/S1517-838220090002000032
- Vidal L, Ares G, Giménez A. Projective techniques to uncover consumer perception. Application of three methodologies to ready-to-eat salads. Food Qual Pref. 2013;28:1–7. http://dx.doi.org/10.1016/j.foodqual.2012.08.005
- Nassivera F, Sillani S. Consumer perceptions and motivations in choice of minimally processed vegetables. A case study in Italy. Br Food J. 2015;117(3): 970-986. DOI 10.1108/BFJ-03-2014-0132
- Nunes NP, Martins CG, Behrens JH, Souza KLO, Genovese MI, Destro MT, Mariza Landgraf M. Radioresistance of Salmonella Species and Listeria monocytogenes on Minimally Processed Arugula (Eruca sativa Mill.): Effect of Irradiation on Flavonoid Content and Acceptability of Irradiated Produce. J Agric Food Chem. 2008;56(4): 1264-1268
DOI: 10.1021/jf072873jDOI: 10.1021/jf072873j - Bruhn CM. Enhancing consumer acceptance of new processing technologies. Innovative Innov Food Sci Emerg Technol. 2007;8(4): 555-558.
- Artés, F, Gómez, P, Aguayo, E, Escalona, V, Artés-Hernández, F. Sustainable sanitation techniques for keeping quality and safety of fresh-cut plant commodities. Postharvest Biol. Technol 2009; 51(3): 287-296.
- Baselice A, Colantuoni F, Lass DA, Nardone G, Stasi A. Trends in EU Consumers’ Attitude Towards Fresh-cut Fruit and Vegetables. Food Qual Pref. 2017;59:87-96. http://
dx.doi.org/10.1016/j.foodqual.2017.01.008 - Cardello AV, Schutz HG, Lesher LL. Consumer perceptions of foods processed by innovative and emerging technologies: A conjoint analysis study. Innov Food Sci Emerg Technol. 2007; 8: 73-83. doi:10.1016/j.ifset.2006.07.002
- Bertazzoli A, Buccioli N, Nocella G. Consumers perception and evaluation of fresh cut buying attributes: A survey on the Italian market. J Food Prod Mark. 2005;11(1): 35–55. doi.org/10.1300/J038v11n01_03
- Ragaert P, Verbeke W, Devlieghere F, Debevere J. Consumer perception and choice of minimally processed vegetables and packaged fruits. Food Qual Pref. 2004;15: 259–270. doi:10.1016/S0950-3293(03)00066-1
- Behrens JH, Barcellos MN, Frewer LJ, Nunes TP, Franco BDGM, Destro MT. Consumer purchase habits and views on food safety: A Brazilian study. Food Control. 2010;21:963–969. doi:10.1016/j.foodcont.2009.07.018
- Basurra RS, Tunung R, Kavita C, Ribka A, Chandrika M, Ubong A. Consumption practices and perception of ready-to-eat food among university students and employees in Kuala Lumpur, Malaysia. Food Res. 2020;5:246-251.
- Ares G, Machín L, Girona A, Curutchet MR, Giménez A. Comparison of motives underlying food choice and barriers to healthy eating among low medium income consumers in Uruguay. Cad Saude Publica. 2017; 33(4): 1-12.
- Massaglia S, Danielle Borra D, Peano C, Sottile F, Merlino VM. Consumer Preference Heterogeneity Evaluation in Fruit and Vegetable Purchasing Decisions Using the Best–Worst Approach. Foods. 2019; 8: 266: 2-16. doi:10.3390/foods8110568