
More Information
Submitted: March 14, 2023 | Approved: March 29, 2023 | Published: March 31, 2023
How to cite this article: Shrestha A, Dahal KR, Mishra SR, Khanal S. Assessment of on farm agrobiodiversity and its role in food sufficiency in mid hill, Nepal. Arch Food Nutr Sci. 2023; 7: 040-048.
DOI: 10.29328/journal.afns.1001048
Copyright License: © 2023 Shrestha A, et al. This is an open access article distributed under the Creative Commons Attribution License, which permits unrestricted use, distribution, and reproduction in any medium, provided the original work is properly cited.
Keywords: Agrobiodiversity; Shannon-Wiener Index; Food sufficiency; Mid-hill; Nepal

Assessment of on farm agrobiodiversity and its role in food sufficiency in mid hill, Nepal
Anjali Shrestha, Khem Raj Dahal*, Sharoj Raj Mishra and Subodh Khanal
Institute of Agriculture and Animal Science, Tribhuvan University, Nepal
*Address for Correspondence: Khem Raj Dahal, Institute of Agriculture and Animal Science, Tribhuvan University, Nepal, Email: [email protected]; [email protected]
A survey was conducted in the agricultural farms in Dhulikhel Municipality, mid-hill, Kavre, Nepal aiming at assessing the status of agrobiodiversity with the purpose of understanding its role in food security taking altogether 133 farming households scattered in several settlements with lowland, upland, and home garden being the general agricultural land use systems. Biodiversity index: Shannon-Wiener Index was used to assess diversity of plant. The main purpose was to assess the farm agrobiodiversity and to find out whether biodiversity level has a direct link to household food self-sufficiency. For descriptive analysis frequency, percentage, mean and standard errors were used. In the case of inferential statistics independent sample t - test and binary logistic was used to find the odd ratio of practicing home garden. The result showed that the average landholding size was 0.66 ha/household with 0.37 ha, 0.3 ha, and 0.06 ha being upland, low land, and home garden, respectively. A total of 136 plant species were documented out of which 74 were the effective number of species in the study area. Among the used plants, fodder shared 27% of the total plant diversity followed by fruit (21%), vegetable (19%), medicinal plants (8%), pulses (8%), spices (7%), oilseeds (5%) and cereals (5%). Similarly, the mean livestock unit (LSU) was 2.65. The overall Shannon-Wiener Index was 4.30 indicating high diversity of species and 87.7% of the species were evenly distributed. The Index was higher for vegetable (3.11) followed by fruits (2.9) and fodder (2.85). Higher diversity was found in fodder trees in lowlands whereas vegetable species were more diverse in upland and home garden. Similarly, the Index was 4.29 in the upland whereas it was 4.078 in the home garden followed by 3.13 in the lowland. The evenness was 0.899, 0.87, and 0.74 in upland, home garden and lowland, respectively. Higher species diversity revealed that the site was rich in agrobiodiversity. A significant positive correlation (0.22) was observed between Shannon-Wiener Index and farming years. Similarly, positive correlation (0.33) was found between an increase in the level of agrobiodiversity and food self-sufficiency. The result demonstrated that increasing crop diversity increases the household’s ability towards food sufficiency implying the need for the formulation and implementation of efficient policy to conserve the agrobiodiversity at municipality as well as national levels.
Biological diversity encompasses three levels of variability: species diversity, genetic diversity (the variability within a group of individuals of the same species) and ecological diversity, which refers to the different ecosystems and landscapes [1]. Similar pattern occurs in relation to agrobiodiversity, which includes the diversity of species (also called inter-specific, for example, different species of cultivated plants, such as corn, rice, pumpkin, tomato; several species of domesticated animal, such as, goat, cow, buffalo etc.), genetic diversity (also called intra-specific diversity, or rather, within the same species, for example, different varieties of rice, wheat, beans; breeds within same animal species etc.), and agricultural or cultivated ecosystem diversity [2,3]. Hence, agrobiodiversity is the variety and variability of crops, animals, microbes and other species that contribute to agricultural production.
Agrobiodiversity is very crucial for the livelihood of farming communities encompassing food provision to environmental protection and maintenance of cultural values [4-6]. The concept of agricultural diversity reflects the dynamics and complex relationships between farmers, plants, animals, and the environments in which they live together, reflecting on the policies of conservation of the cultivated ecosystems, promotion of nutritional and food security, social inclusion, achievement of sustainable development goals and local sustainable development [3,7-9].
The economy of Nepal is based on the use of natural resources including agricultural lands, and plant and animal genetic resources. Diverse climatic conditions, varied socioeconomic settings, differences in altitude, and complex topography are responsible for making Nepal rich in agrobiodiversity) [10-12]. Nepal stands in the tenth position in terms of flowering plant diversity in Asia and 31st on a worldwide scale [13]. About 21% (3.2 million hectares) of the total land area of Nepal is used for cultivation and the principal crops are rice (45%), maize (20%), wheat (18%), millet (5%), and potatoes (3%), followed by sugarcane, jute, cotton, tea, barley, legumes, vegetables, and fruits. Crops such as rice, rice bean, eggplant, buckwheat, soybean, foxtail millet, citrus, and mango have high genetic diversity relative to other food crops [11,13].
In the developing world where many small-scale farmers still make extensive use of the plant genetic diversity present in their surroundings for home consumption, as dietary source, provision of medicines. In future, Biodiversity at all four levels such as molecular, genetic, species and ecosystems proved to become more and more valuable for supporting food security, social and environmental benefits [14]. A direct connection in between the richness of biodiversity and ensuring food security is today supported at the highest political agenda [15].
Agrobiodiversity and food security have great interdependence [16]. Food security depends on the sustainable management of the biological resources important for food and agriculture [6,17-19]. Increasing on-farm crop diversity is an agroecological approach to enhance the foodso self-sufficiency of small-scale farmers [19-21]. Conservation and utilization of existing biological diversity in agricultural landscapes have been proposed as a way for sustainable agriculture production, diversity of diet with additional benefit for livelihoods [20,22-25]. The role of farmlands in providing rural food security and maintaining biodiversity has received little attention in the existing body of literature. Several studies have focused on the status of agrobiodiversity in home gardens only with little attention on farmland as a whole. Sustainable benefits can be derived for present and future generations through protection and scientific management of agrobiodiversity [26,27]. By documenting the diversity of the farmland as a whole, plans may be devised to conserve it.
This research has made an attempt to document the agricultural diversity in the study area and assess its relationship with food self-sufficiency. Understanding the level of agrobiodiversity is essential baseline information for formulating the conservation policy in enhancing biodiversity in agricultural landscapes based on utilization and conservation in Nepal [28]. This study can provide baseline information on the status of agrobiodiversity in the farmlands in Dhulikhel, mid-hill, Nepal.
The study was conducted in rural areas of Dhulikhel Municipality located in the central mid-hill region of Nepal. The geographical location of the study area is 27°37´N latitude and 85°33´E longitude [29]. The site stretched from 900masl to 1800masl. Garmin GPS was used to record the location and elevation of the household. The unit of analysis of the study was households for socio- economic study, factors influencing agrobiodiversity, and farms for crop species diversity assessment [30-32]. The household information was collected by interviewing the head of the family. A total of 133 randomly selected households were included in the survey from different communities. The villages under study included Patlekhet ward 11(Kharka village, Gairaghare village, Thulitar village) and ward 8 (Badalgaun community) of Dhulikhel Municipality. Thirty percent of the total households were selected as a sample following [30,33,34] Table 1.
| Table 1: The sample size of households surveyed for agrobiodiversity in the study site, 2019. | ||
| Study site | Total household | Sample size |
| Kharka Village | 100 | 30 |
| Gairaghare Village | 80 | 24 |
| Thulitar Village | 176 | 52 |
| Badalgaun Village | 88 | 27 |
Focus group discussions, key informant interviews and field observations were used to collect the primary data [31,35]. In the same way, secondary data were extracted from different reports, books published by private firms, government and non-government organizations working in the relevant sector, published articles, working papers, and published thesis. Based on the information and literature, crop species were classified into different categories such as cereal, legumes, spices, fruits, vegetables, medicinal plants and fodder. In the case of inferential statistics independent sample t - test and binary logistic was used to find the odd ratio of practicing home garden [36]. The odd ratio in binary logistics represents the association between the dependent and independent variables. Correlation analysis was done between demographic factor (farming year and age) and between agrobiodiversity and food self-sufficiency months.
The following biodiversity-related indices were utilized to evaluate the agrobiodiversity:
Shannon Wiener Index
Shannon Wiener index was calculated from the equation:
The quantity pi is the proportion of individuals found in i - th species.
pi = number of counts of individual crop species / total number of counts of all individual crop species
The value of the Shannon index obtained from empirical data usually falls between 1.5 to 3.5 and rarely surpasses 4. [35,37]. SWI has been used in some of the study of home gardens for the species diversity [35,38,39].
Shannon evenness
The Shannon index considers the degree of evenness based on abundance. The ratio of observed diversity to maximum diversity is used to measure the evenness (J’) [37].
S is the species richness
J’ is evenness
H’ is SWI
The effective number of species
The number of equally abundant species needed to obtain the same mean proportional species abundance as that observed in the data set of interest, where all species may not be equally abundant is referred to as the effective number of species [40]. The effective number of species was calculated by taking the exponential value of SWI.
The effective number of species = eH
H = Shannon wiener index of diversity [37]
To assess the diversity at the farm level the farms of the respondents were grouped into four categories based on land holdings size: marginal, small, medium and large following Baul, et al. [28].
Livestock unit
The mean livestock unit (LSU) in the study site was calculated following FAO [41] in which the values were 0.50 for cattle, buffalo and 0.10 for sheep and goats; 0.20 for pigs; 0.65 for the horse; 0.60 for mules; and 0.01 for chicken in context of south Asia.
Socioeconomic characteristics
The survey showed that 80.5% of the households were headed by a male and 19.5% of households had female heads. It was found from the survey that 31.6% of the respondents were illiterate; 50% had primary education; and 19.6% had secondary and above education. The mean family size was 5.2 ± 2.080. The respondents were dominated by the common farmers being 88.7% whereas 11.3% were from a marginalized group. Agriculture was the main occupation of the respondents (82.7%) whereas they were also engaged in shops, employment, and others. The average land holding of the respondents was 13.0619 ± 1.26 Ropani (0.66 ha), which was similar as compared to the national average land holding size (11.79 Ropani). The lands were categorized as upland, lowlands and home gardens according to the purpose of use (Tables 2-4).
| Table 2: Farm categorization. | ||
| Farm Category | Farm area in ropani | Farm area (ha) |
| Category 1(marginal farm) | Equal or less than 5 ropani | Equal or less than 0.254 ha |
| Category 2 (small farm) | 6-10 ropani | 0.305-0.508 ha |
| Category 3 (medium farm) | 11-20 ropani | 0.55-1.071ha |
| Category 4 (large farm) | More than 20 ropani | > 1.07 ha |
| Table 3: Socioeconomic characteristics of respondents in the study site, 2019. | |
| Household head Gender (Frequency) | |
| Male | 107(80.5%) |
| Female | 26(19.5%) |
| Education (Frequency) | |
| Illiterate | 42(31.6%) |
| Primary | 66(50%) |
| Secondary and higher | 25(19.6%) |
| Occupation (Frequency) | |
| Agriculture | 110(82.7%) |
| Shop | 7(5.3%) |
| Government employee | 3(2.3%) |
| Others | 13(9.7%) |
| Ethnicity (Frequency) | |
| Common | 118(88.7%) |
| Marginalized | 15(11.3%) |
| Total land holding (Ropani) | 13.0619 ± 0.78 |
| upland area (Ropani) | 7.4114 ± 0.57 |
| lowland area (Ropani) | 6.12 ± 0.36 |
| Home garden size (Ropani) | 1.27 ± 0.10 |
| Family size | 5.2 ± 0.1 |
| Age | 50.81 ± 1 |
| Note: Figure in parenthesis represents percentage: 1 Ropani = 0.05085 ha | |
| Table 4: Land use pattern of respondents in the study site, 2019. | |
| Land | Frequency |
| HG | 95(71.4%) |
| UL | 123(92.4%) |
| LL | 114(85%) |
| The figure in parenthesis represents the percentage | |
Crop species diversity assessment
The study showed that there was a total of 136 plant species documented in the study site of which 36 were general trees species, 29 were fruit crops, 26 were vegetables, 11 were legumes, 11 were medicinal plants, 10 were spices, 7 were grain crops, 6 were oilseed crops with an average number of species per household being 47.36 ± 0.95. This data demonstrated that farmers had diverse crop, majority having more than one crop combination. The finding of this study corroborates Sunuwar [42] where the western Terai had 123 crop species (27.1 ± 10.7) whereas 131 species (38.7 ± 10.5) were recorded in the western mid-hill of Nepal. Similarly, 122 species from home garden were documented in Barak Valley, Assam, Northeast India [43]; 149 plant species were documented in Central Sulawesi, Indonesia [44]; and 39 crop species across the region were recorded among the 60 households surveyed in eastern Kenya [45]. The study also revealed that the majority of these crop species are grown for domestic consumption. Considering tree species in the study site, there appeared a reasonably good assemble of plant community with 36 tree species contributing substantially to the livelihood through wood, fuel wood, fodder, medicine, and other uses. A study conducted by Baul, et al. [28] in central mid hill supported the contribution of farm trees to the fodder supply.
Crop species based on their function
The data showed that the farmland provides continuous food and other supplies as diverse plant species were grown to serve different purposes. Of the total grown plant species, 27% was fodder, 21% fruit, 19% vegetable, 8% medicinal, 8% pulse, 7% spice, 5% oilseed, and 5% cereals (Figure 1). Fodder, fruit and vegetable species were diverse and dominant. The farming system is an intimate mix of diversified crops and multipurpose trees planted and maintained by the farmers.
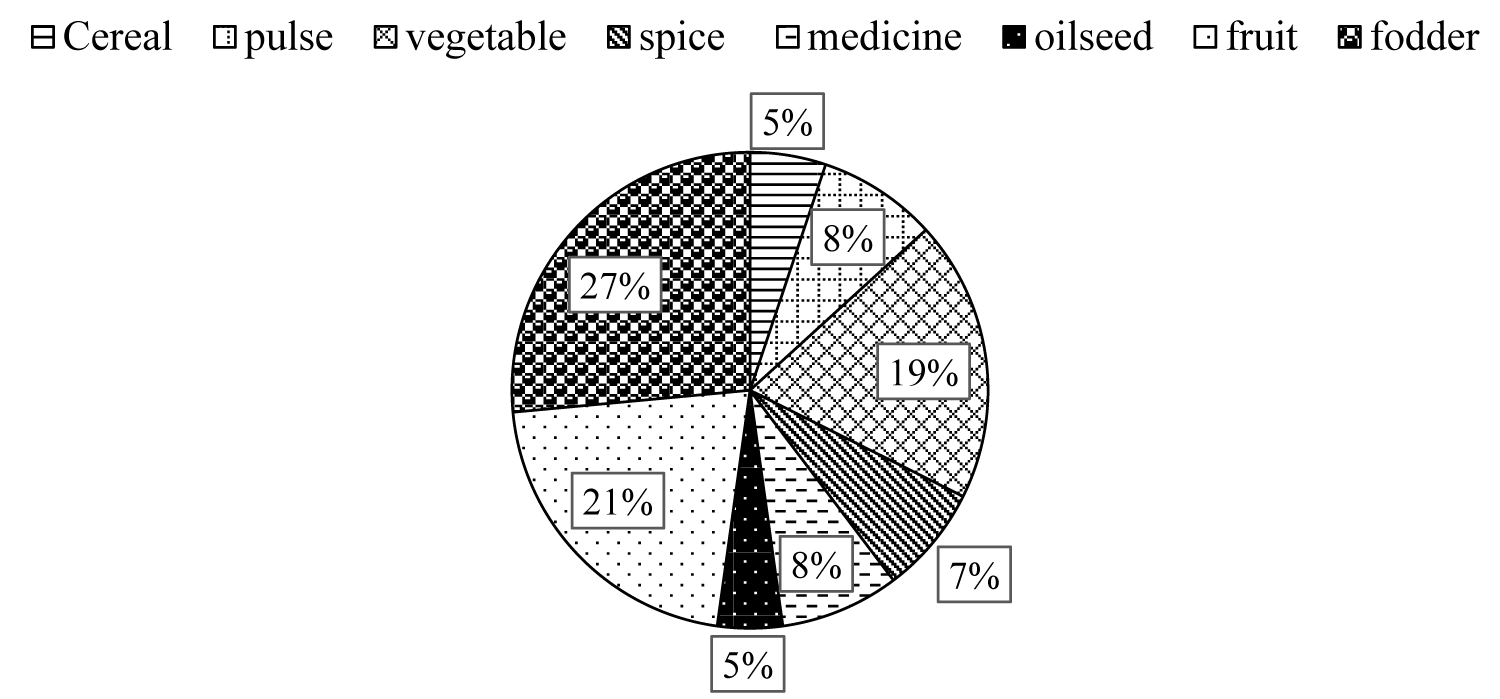
Figure 1: Percentage of crop use category (Household survey, 2019).
Plants with sale value as cash crops were vegetables: cauliflower, tomato, cucumber, broccoli, potato, pumpkin.
The effective number of crop species
The effective number of crop species was 74 i.e., out of 136 crop species, 74 were common. Effective number of species of vegetables, fruit, fodder, legumes, medicinal plants, spices, cereal, and oilseed were 22, 18, 17, 8, 6, 5, 4, and 3 respectively. Vegetables have the highest effective count of species followed by the fruit, fodder, pulse, medicinal plants, spices, cereal crops and oilseed crops. Khanal, et al. [35] reported 30 effective species out of 106 in the Katahari Rural Municipality of Nepal. Farmers grow different crops in different seasons to meet their food requirements Figure 2.
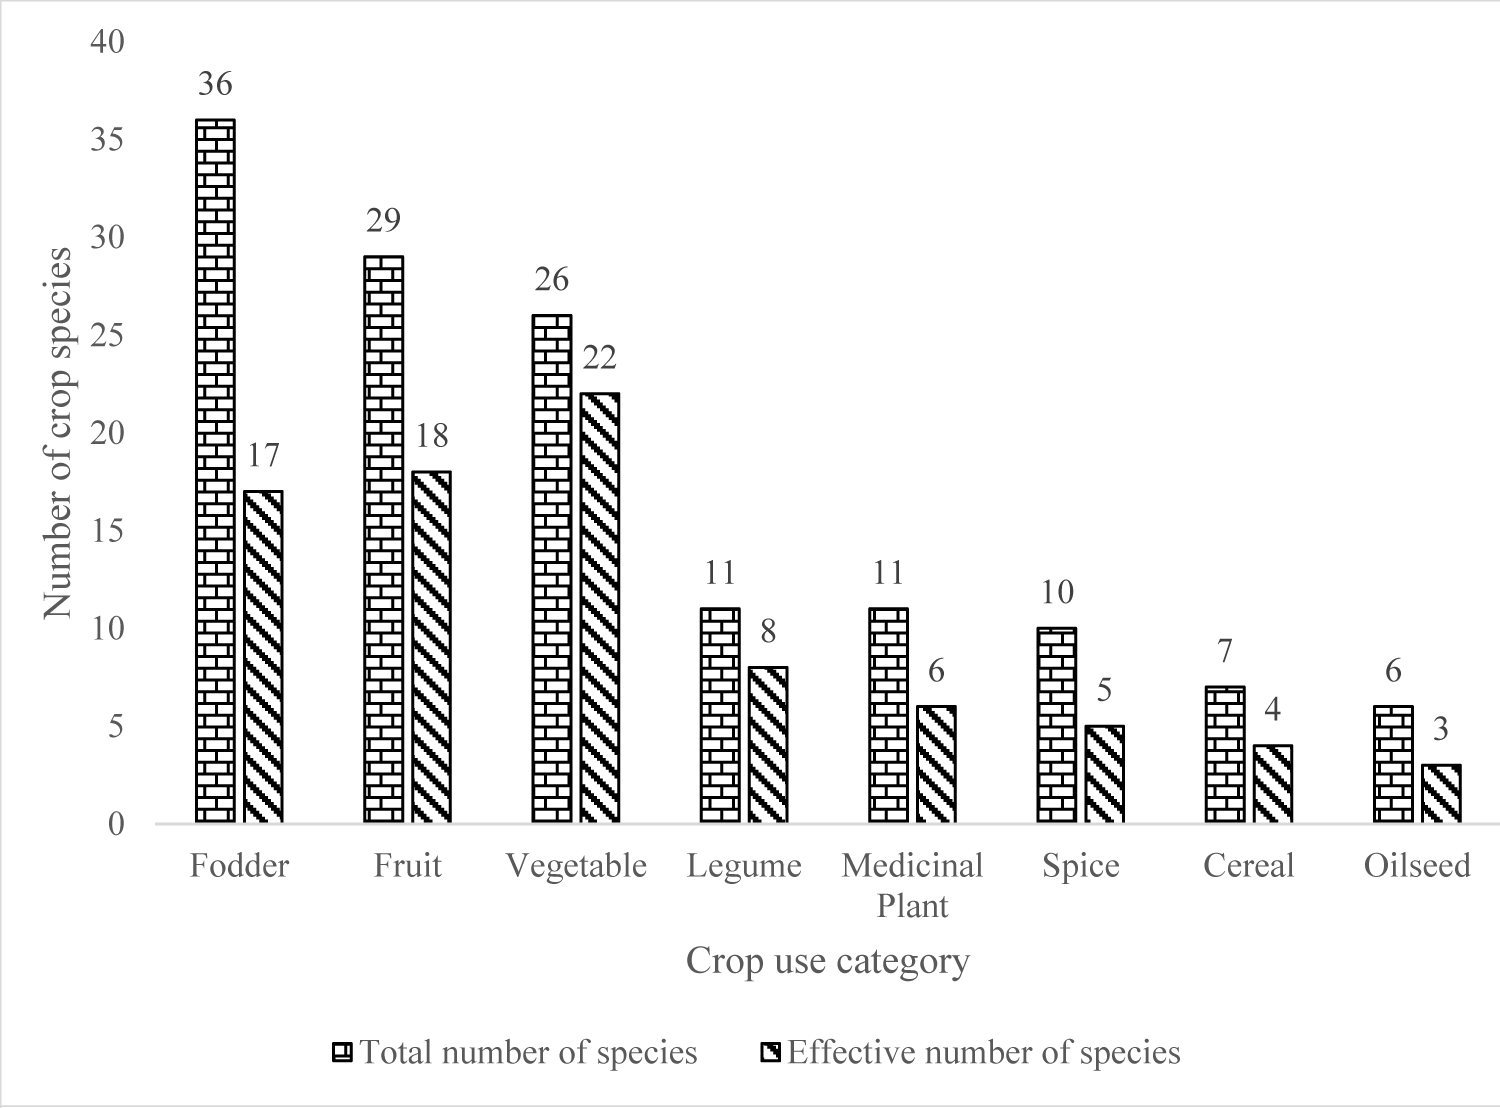
Figure 2: The effective number of different crop species (Household survey, 2019).
Livestock unit
The result showed that animal husbandry was practiced by almost all of the farmers keeping a cow, buffalo, poultry (chicken), pig, and goat; one or some of them. Types of livestock showed to vary according to the need of the household [46]. Livestock rearing is interlinked with crop production as farm yard manure (FYM) is applied by most of the farmers along with chemical fertilizers. At the same time, livestock contributes to the household income and nutrition. Animal holding converted to Livestock Units (LSU) showed to be 2.65 per household. In a similar study by Paudel, et al. [47] western Terai landscape of Nepal was found to be 2.9. Paudel, et al. [47] and Baul, et al. [28] suggested that with the increase in livestock larger quantities of fodder trees are needed, and there by increased number of trees and their diversity. The study by Acharya (2006) showed that the number of tree species per household increased with the number of livestock units. However, such relationship was not found in our study.
Species diversity assessment based on the use of crop species
The result on the species diversity assessment is depicted in the Table 5 which shows that the overall, Shannon Wiener Index of the study site was 4.30 which indicated the maximum species diversity as the typical values of SWI is generally between 1.5 and 3.5 in most ecological studies Magurran [37]. Similar research carried out by Sunwar [42] also found higher species diversity in the home garden of the western mid-hill. The Evenness index of species in this study site (0.877) revealed that 87.7% of species were equally abundant and evenly distributed. Vegetables were highly even (63.5%) whereas oilseed species were least even (25%). SWI for vegetables, fruit, fodder, legumes, medicinal plants, spices, cereal, and oilseed were 3.11, 2.9, 2.85, 2.16, 1.81, 1.74, 1.43, and 1.23, respectively. The diversity was highest in vegetables (3.11) followed by fruit (2.9), fodder (2.85), legumes (2.16), medicinal plants (1.81), and spices (1.74). The SWI increases as both the richness and the evenness of the community increase [37] Table 6.
| Table 5: Irrigation in different land use patterns in the study site, 2019. | |
| Low land | Frequency |
| Rainfed | 9(7.6%) |
| Rainfed and irrigated | 105(92.4%) |
| Upland | |
| Rainfed | 92(75%) |
| Rainfed and irrigated | 31(25%) |
| Home garden | |
| Rainfed | 56(58.8%) |
| Rainfed and irrigated | 39(41.2%) |
| Figure in parenthesis represents percentage | |
| Table 6: Species diversity assessment based on crop use in the study site, 2019. | |||
| Agrobiodiversity | SWI | ENS | Evenness in percentage |
| Overall Species | 4.30 | 74 | 87.7 |
| Vegetables | 3.12 | 22 | 63.5 |
| Fruits | 2.90 | 18 | 59 |
| Fodder | 2.85 | 17 | 58 |
| Legumes | 2.16 | 8 | 43.9 |
| Medicinal Plants | 1.81 | 6 | 36.8 |
| Spices | 1.74 | 5 | 35.4 |
| Cereal | 1.43 | 4 | 29.1 |
| Oilseed | 1.23 | 3 | 25 |
| (Household survey, 2019) | |||
Species diversity assessment by land use category
The data showed that the SWI in the home garden was 4.078 whereas 3.13 and 4.29 were in lowland and upland, respectively. In the same way, the evenness in the land use category were 0.87, 0.74 and 0.89 in home garden, low land, and upland, respectively. Study by Baul, et al. [28] found that lowlands are used for cultivation of cereal and vegetable crops and are the most valuable land to produce major food crops. Lowland is used for paddy (main crop) cultivation and hence has comparatively lower species diversity. Depending on adaptive characteristics of crops, diverse crops were grown on home garden, low land and upland [32].
Crops and their species diversity in different land use categories
Home garden: The result showed that the SWI values for vegetables were 3.19; for fruit was 2.91; for fodder tree was 2.67; for legume was 2.03; for spices was 1.8; for the medicinal plant was 1.78; for oilseed was 1.08; and for cereal 0.75 were found in home garden indicating the higher species diversity in vegetables (Table 7). Sunwar [42] has also reported that vegetables are the major component of Nepalese home gardens and maintain higher diversity. A similar study done by Khanal, et al. [35] reported the SWI to be 0.942 for Cereal; 1.304 for fruits; 1.24 for medicinal plants; 1.59 for vegetable and spices; and 1.045 for fodder and trees in the home garden in Katahari, eastern plain of Nepal.
| Table 7: Species diversity assessment based on land use pattern in the study site, 2019. | |||
| Land use pattern | SWI | ENS | Evenness |
| Home garden Lowland |
4.078 3.13 |
59.04 22.64 |
0.87 0.74 |
| Upland | 4.29 | 72.63 | 0.89 |
| (Household survey, 2019) | |||
Lowland: Table 7 depicts the SWI for various crops groups: 2.20 for vegetables; 2.27for fodder tree; 2.07 for the medicinal plant; 1.79 for fruit; 1.60 for legume; 1.10 for spice; 1.07 for cereal; and 0.39 for oilseed in lowland indicating the higher diversity in fodder trees and vegetables. It was also found that the most commonly grown species in lowland were rice and wheat. Similarly, Soybean was the most commonly cultivated legume crop, mostly planted on the bunds of rice fields. Potato and tomatoes were the commonly grown vegetables whereas onion and perilla were the popular spice and oilseed crops, respectively. The study by Baul, et al. [28] found that lowlands are used for the cultivation of cereal and vegetable crops and are the most valuable land to produce major food crops.
Upland: The result showed the different SWI values for different crop groups: 3.2 for vegetable; 2.86 for fodder tree; 2.65 for fruit; 1.9 for legume; 1.81 for medicinal plant; 1.8 for spice; 1.2 for cereal; and 0.83 for oilseed in upland land use category (Table 7). Maize was the most commonly grown cereal crop whereas cowpea and faba bean were the most common legumes. Chenopodium album locally known as bethe saag, regarded as a weed but consumed as a green leafy vegetable, was abundant in maize terraces. During the scarcity of vegetables, people heavily depend upon gathering these from their natural habitat [48]. The upland land has also been used for growing several species of seasonal vegetables for domestic and commercial purposes all year round [28]. In the upland as well as in the home garden, vegetable species were more diverse, but in the lowlands, SWI of fodder tree was found to be on the higher side. Of all three-land use categories, upland was found to have a higher diversity of fodder and vegetables.
Paudel, et al. [47] analyzed species diversity for various crop groups: vegetables, fruits, fodder, and forage based on land use (corridor, intensive agriculture land use type, and buffer zone) using Shannon- Wiener Index. 3.21, 2.73, 1.99, 2.55 were the SWI index for vegetable, fruit, forage and fodder respectively in the corridor. 3.18, 2.77, 2.21 and 2.5 were the SWI for vegetable, fruit, forage, and fodder respectively in intensive agriculture land use type. Results indicated that the effects of land use were visible in inter-species diversity Table 8.
| Table 8: Species diversity assessment based on crop use and land use pattern in the study site, 2019. | |||||||||
| Land use pattern | Index | C | L | V | S | M | O | Fr. | Fo. |
| Home garden | SWI | 0.755 | 2.032 | 3.19 | 1.8 | 1.78 | 1.08 | 2.91 | 2.67 |
| ENS | 2.1 | 7.6 | 24.3 | 6.6 | 6 | 2.9 | 18.2 | 14.4 | |
| Evenness | 0.68 | 0.88 | 0.98 | 0.86 | 0.856 | 0.67 | 0.86 | 0.92 | |
| Lowland | SWI | 1.07 | 1.60 | 2.2 | 1.1 | 2.07 | 0.39 | 1.79 | 2.27 |
| ENS | 2.9 | 5 | 9 | 3 | 8 | 1.47 | 6 | 9.7 | |
| Evenness | 0.66 | 0.732 | 0.74 | 0.5 | 0.94 | 0.56 | 1 | 0.91 | |
| Upland | SWI | 1.2 | 1.9 | 3.20 | 1.8 | 1.81 | 0.83 | 2.65 | 2.86 |
| ENS | 3.4 | 7.17 | 24.5 | 6.61 | 6.17 | 2.3 | 14.2 | 17.46 | |
| Evenness | 0.68 | 0.89 | 0.98 | 0.91 | 0.875 | 0.46 | 0.88 | 0.813 | |
| (Household survey, 2019) {C: Cereal; L: Legumes; V: Vegetable; S: Spices; M: Medicinal plant; O: Oilseed crop; Fr. : Fruit; Fo. : Fodder; EN: Effective number of species} |
|||||||||
Diversity assessment by land holding size of farm
The species diversity was assessed and presented in the table below:
The species diversity was assessed based on farm size as well. As demonstrated in Table 9, the SWI in the large farms was 3.81 whereas in medium, small, marginal farms were 3.8, 3.72 and 3.11, respectively. Similarly, the evenness in the large farm was the highest (0.78) followed by medium farm (0.77), small farm (0.75), and marginal farm (0.6347). At the same time, the effective number of species found on large farms was 46 followed by the medium farm (45), small farms (41), and marginal farm (22). The result also showed that the effective number of species increased with increasing farm size showing a strong relationship between farmland size and species diversity. Similar results were also observed by Baul, et al. [28], who reported a strong relationship between farm size and species richness in the Pokhare Khola watershed, Dhading, mid hill, Nepal.
| Table 9: Farm categorization and species diversity assessment in the study site, 2019. | |||
| Farm category | SWI | ENS | Evenness |
| Category 1(marginal farm) | 3.11 | 22 | 0.6347 |
| Category 2 (small farm) | 3.72 | 41 | 0.75 |
| Category 3 (medium farm) | 3.8 | 45 | 0.77 |
| Category 4 (large farm) | 3.81 | 46 | 0.78 |
| (Household survey, 2019) | |||
Influence of elevation on farm size and species diversity
An independent sample t - test was done to compare the level of agrobiodiversity in the farms located in elevations below 1300 and ≥ 1300 masl. Table 10 depicts that the area of the home garden with the number of vegetables and fodder species was significantly higher in the elevations from 1300 to 1800masl. Similarly, the overall total species of crops were significantly higher in the elevation of 1300 masl and above. This might be due to the fact that the household was more scattered with extended farm size and the household as the altitude increases has a strong affinity to grow diverse plant species to meet the daily requirements. Similar studies by Rocky and Sahoo [49] found a higher diversity of vegetables and fruits in high altitudes in the Aizawl district of Mizoram, India. Further, the villages especially focusing on the home gardens were grouped focusing into three altitudinal ranges: high altitude >1200 masl, mid-altitude (300 - 1200 masl) and low altitude (< 300 masl). It was found that overall 133 food plants were found to supply various foods, vegetables, and fruits with higher diversity in high altitude (104), followed by low altitude (95) and mid-altitude (95) sowing more number of vegetables and tree species with the high frequency of occurrence in high altitude Table 11.
| Table 10: Influence of altitude on agrobiodiversity in the study site, 2019. | ||||
| LSU | Area of HG | Area of lowland | Area of Upland | |
| Below 1300 | 2.9557 ± 0.40015 | .723 ± 0.1223 | 5.45 ± 0.3808 | 5.99 ± 0.685 |
| ≥ 1300 masl | 2.32 ± 0.388 | 1.2 ± 0.2043 | 5.157 ± 0.6372 | 7.81 ± 0.883 |
| T-value | 1.13ns | -2.055* | .404ns | -1.64ns |
| Ns: not significant; * significant at the 5% level of significance; ** significant at 1% level of significance (Household survey, 2019) |
||||
| Table 11: Influence of altitude on agrobiodiversity by crop groups in the study site, 2019. | |||||||||
| C | P | V | S | M | F | Fo | O | Total crop species | |
| Below 1300 | 3.01 ± 0.84 | 6.76 ± 0.204 | 18.5 ± 6.654 | 5.56 ± 0.176 | 4.33 ± 0.183 | 3.19 ± 0.324 | 3.17 ± 0.243 | 1.97 ± 0.077 | 44.90 ± 1.615 |
| ≥1300 masl | 3 ± 0.86 | 6.97 ± 0.177 | 21.46 ± 0.435 | 5.92 ± 0.114 | 4.62 ± 0.180 | 2.59 ± 0.187 | 4.49 ± 0.291 | 1.89 ± 0.105 | 50.10 ± 0.825 |
| T-value | 0.097 | -0.774ns | -3.137** | -1.695ns | -1.128 | 1.55 | -3.508** | .683** | -2.733** |
| ns: not significant; * significant at the 5% level of significance; ** significant at the 1% of significance level (Household Survey, 2019) |
|||||||||
Odds of practicing home garden
Analysis of ethnicity, altitude range, LSU, years of farming, education, and occupation yielded mixed results in terms of their relationship with the presence of a home garden [50]. The results from the binary logistic regression are presented in Table 12 which shows that the household- rearing livestock was found to have a 1.004 increase in the likelihood of having a home garden. Household education was found to have a 1.2866 increase in the likelihood of having a home garden. Years of farming, occupation, and ethnicity were found to have 1.003, 1.689, and 1.233 increases in log odds of having a home garden, respectively. None of these were found to be statistically significant. Altitude was found to be strongly associated with the presence of a garden in the model. The model was significant. 14.1% variation was explained by independent variables.
Of all the independent variables, households located at ≥ 1300 masl have the association with the likelihood of a garden. The model (Table 12) shows that the households located above 1300 masl i.e., at higher altitudes experience a 4.45 increase in log odds of having a garden. This might be due to the fact that as the altitude increases the household were more scattered and the farms with free- standing houses have the strongest association with a home garden. A study carried out in Ohio State of USA found that household located in free-standing houses experiences a 2.24 increase in log odds of having a garden compared to all other types of housing [36].
| Table 12: Odds of practicing home garden in the study site, 2019. | |
| Independent variables | Odd ratio |
| Ethnicity(1 = Elite) | 1.233 |
| Altitude range (1 = below 1300 m) | 4.545** |
| Livestock unit | 1.004 |
| Years of farming | 1.003 |
| Education(1 = Educated) | 1.286 |
| Occupation(1 = Agriculture) | 1.689 |
| Intercept | 0.10* |
| Model chi square | 13.55* |
| Negelkerke R2 | 0.141 |
| % correctly predicted | 69.2 |
| ns = not significant; *significant at the 5% level of significance; **significant at the 1%level of significance (Household survey, 2019) |
|
Correlations between crop species and years of agriculture practice
Based on correlation analysis, it was found that years of farming have significant effect on the numbers of vegetables, spices, medicinal plants, and total crop species. A weak but positive correlation was noticed in the pulse and fodder tree (Table 13). Mburu, et al. [45] in Kenya stated that the higher crop diversity may be due to farming experience. Khanal, et al. [35] and Paudel, et al. [47] also reported a positive correlation (0.21) between total crop species (cereals, fruits, medicinal plants, vegetables, spices) and farming year.
| Table 13: Correlation of agrobiodiversity with years of agriculture practice in the study site, 2019. | |
| Crop species | Years of Agriculture Practiced |
| Cereal | -0.164 |
| Pulse | 0.053 |
| Vegetable | 0.226** |
| Spices | 0.222* |
| Medicinal Plants | 0.228** |
| Oilseed | -0.152 |
| Fruit | -0.047 |
| Fodder tree | 0.164 |
| No. of species per respondent | 0.244** |
| ** significant at the 1% level of significance; * significant at the 5% level of significance (Household survey, 2019) |
|
Correlations between food sufficiency and crop diversity
The result showed a significant positive correlation between the number of species of cereal, pulse, vegetable, spice, and medicinal plants with food sufficiency. The crop species diversity was found to have significantly contributed to food sufficiency in the study area. The result corroborates with similar other findings [47,51]. Paudel, et al. [47] stated that food self-sufficiency was positively associated with the diversity of vegetables, fruits, and forage Table 14.
| Table 14: Correlation between different crop speciesand food self- sufficiency in the study site, 2019. | |
| Crop species | Food self-sufficiency months |
| Cereal | 0.281** |
| Pulse | 0.202* |
| Vegetable | 0.314** |
| Spices | 0.218* |
| Medicinal | 0.185* |
| Oilseed | 0.042 |
| Fruit | 0.058 |
| Fodder and tree | 0.118 |
| No. of species per respondent | 0.335** |
| ** significant at the 1% level; *significant at the 5% level (Household survey, 2019) |
|
Food self -sufficiency months
Paudel, et al. [47] measured food security as the total number of months for which the household production can feed the household member. Food sufficiency conditions in our study site showed that of the total household, 48.1% had sufficient food for all the year round whereas 24.8% had sufficient food only for 9-11 months. Similarly, 22.6% of the households had food sufficiency for only 6 to 9 months and 4.5% had food sufficient for less than 6 months. KC (2016) has reported that food self-sufficiency ensures food security which is s influenced by agricultural biodiversity Figure 3.
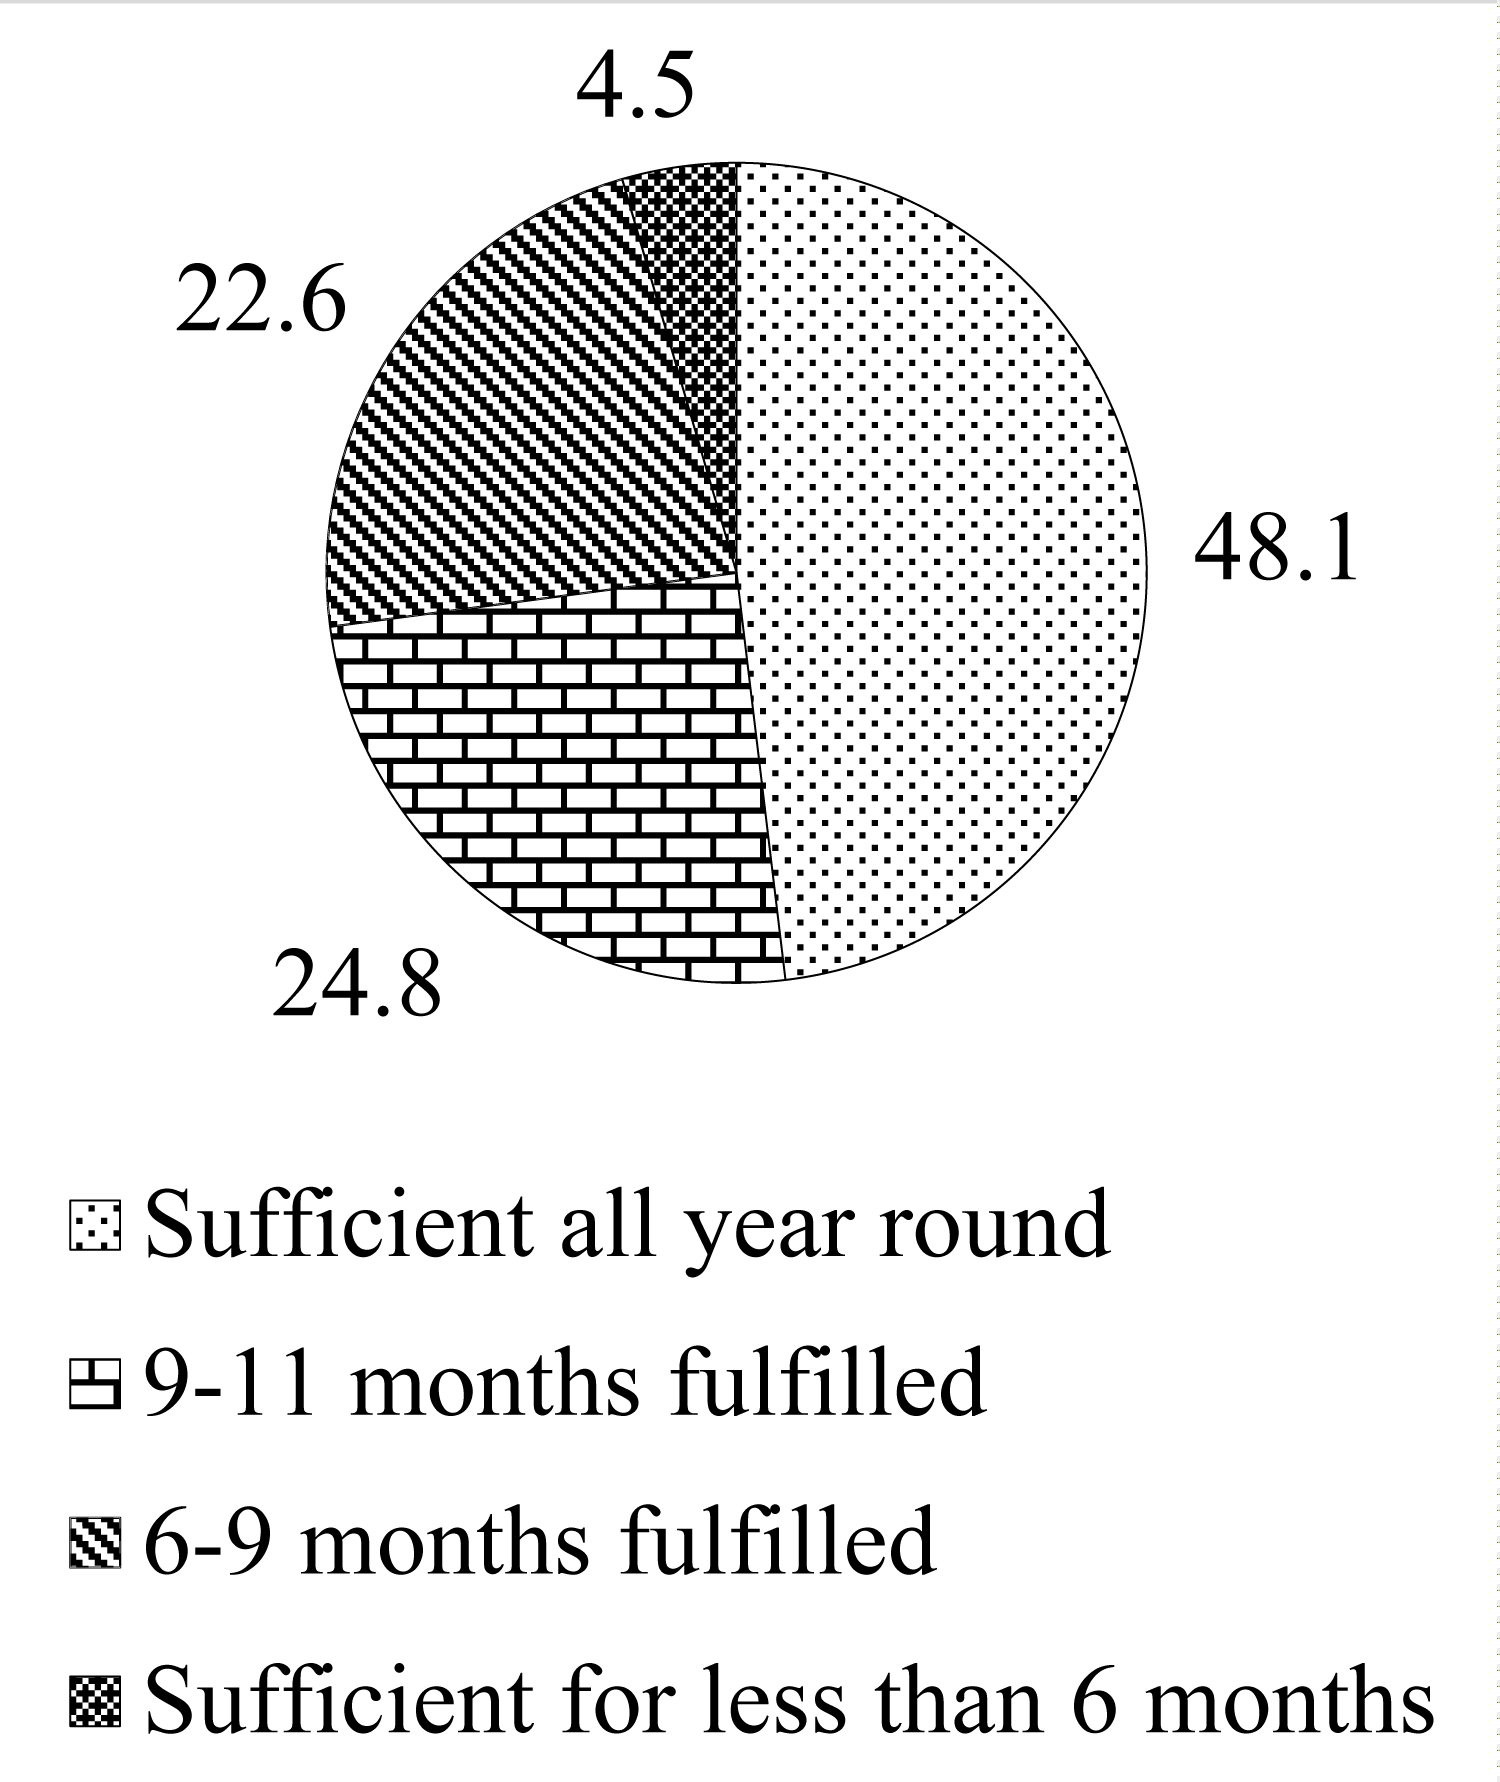
Figure 3: Food self-sufficiency Months in the study site, 2019..
A total of 136 plant species were documented in the study area of Dhulikhel Municipality, Kavre District of Mid Hill Nepal of which 6 were categorized as oilseeds; 7 cereals; 10 spices; 11 medicinal herbs; 11 legumes; 26 vegetables; 29 fruits; and 36 fodders. Effective number of species of vegetables, fruit, fodder, legumes, medicinal plants, spices, cereal, and oilseed were 22, 18, 17, 8, 6, 5, 4 and 3 respectively. The overall, Shannon-Wiener Index was 4.30 indicating the high level of diversity of species. SWI for vegetables, fruit, fodder, legumes, medicinal plants, spices, cereal, and oilseed was 3.11, 2.9, 2.85, 2.16, 1.81, 1.74, 1.43, and 1.23 respectively. Fodder trees were found to be more diverse in lowlands whereas the diversity of vegetables was more in homesteads, uplands and home gardens. The Shannon index in home garden was 4.078 whereas that was 3.13 low lands and 4.29 in the upland.
The Shannon Wiener index along with effective number of species, revealed a high level of diversity of crop species with even distribution in the study area. The crop diversity and food self-sufficiency months were positively correlated. The plant diversity significantly contributed to the month of food self-sufficiency. Years of farming significantly affected the numbers of vegetables (0.226), spices (0.222), medicinal plants (0.228), and total crop species (0.244). Food security strategies, particularly for small-scale farmers, would need a sustainable use of biodiversity in farms through optimizing the available resources. Assessment of agricultural diversity at farms level indicates its vital role in sustaining livelihood through ensuring food security among farming communities. Appropriate and efficient management of agrobiodiversity through utilization and conservation is of paramount importance at household level. The information collected on the on-farm species diversity suggests that farms could be the crux for in-situ conservation of crop biodiversity. Development of local specific conservation policy for agrobiodiversity at municipality level is suggested.
Limitations
The research was conducted in rather a small landscape of mid hill, which may limit its inference in wider domain. The focus was on commonly cultivated crop species and important but neglected and nutritious crop species were not covered due to time and logistic constraints.
- Index MT. Convention on biological diversity. Science. 2004; 279: 860-863.
- Holt AR, Alix A, Thompson A, Maltby L. Food production, ecosystem services and biodiversity: We can't have it all everywhere. Sci Total Environ. 2016 Dec 15;573:1422-1429. doi: 10.1016/j.scitotenv.2016.07.139. Epub 2016 Aug 15. PMID: 27539820.
- PAR. Assessing agrobiodiversity: A compendium of methods. Rome. 2018; 90.
- Altieri MA, Funes-Monzote FR, Petersen P. Agroecologically efficient agricultural systems for smallholder farmers: contributions to food sovereignty. Agronomy for Sustainable Development. 2012; 32: 1-13.
- Furman B, Noorani A, Mba C. On-Farm Crop Diversity for Advancing Food Security and Nutrition. In Landraces-Traditional Variety and Natural Breed. IntechOpen. 202.
- Zsögön A, Peres LEP, Xiao Y, Yan J, Fernie AR. Enhancing crop diversity for food security in the face of climate uncertainty. Plant J. 2022 Jan;109(2):402-414. doi: 10.1111/tpj.15626. Epub 2021 Dec 21. PMID: 34882870.
- Zimmerer KS, Jones AD, de Haan S, Creed-Kanashiro H, Tubbeh RM, Hultquist C, Nguyen KT. Integrating Social-Ecological and Political-Ecological Models of Agrobiodiversity with Nutrient Management of Keystone Food Spaces to Support SDG 2. Frontiers in Sustainable Food Systems. 2022; 6: 115.
- Jones SK, Estrada-Carmona N, Juventia SD, Dulloo ME, Laporte MA, Villani C, Remans R. Agrobiodiversity Index scores show agrobiodiversity is underutilized in national food systems. Nature Food. 2021; 2(9): 712-723.
- Sharma R, Mina U, Kumar BM. Homegarden agroforestry systems in achievement of Sustainable Development Goals. A review. Agron Sustain Dev. 2022;42(3):44. doi: 10.1007/s13593-022-00781-9. Epub 2022 May 23. PMID: 35646163; PMCID: PMC9125548.
- Joshi BK, Acharya AK, Gauchan D, Bhatta MR. Agrobiodiversity status and conservation options and methods. In proceedings of second national workshop. Kathmandu, Nepal. 2017; 28-31.
- Joshi BK, Upadhya D. On-farm conservation approaches for agricultural biodiversity in Nepal. Journal of Agriculture and Natural Resources. 2019; 2(1): 14-35.
- Joshi BK, Gauchan D. Agrobiodiversity, and Neglected and Underutilized Species for Food, Nutrition, Livelihood, and Environmental Security in Nepal. In Agriculture, Natural Resources and Food Security: Lessons from Nepal. Cham: Springer International Publishing. 2022;
- MoAD. State Report on Biodiversity for food and agriculture. Ministry of Agriculture Development, Food security and Environment Division, Nepal. 2019; 259.
- Pathirana R, Carimi F. Management and Utilization of Plant Genetic Resources for a Sustainable Agriculture. Plants (Basel). 2022 Aug 4;11(15):2038. doi: 10.3390/plants11152038. PMID: 35956515; PMCID: PMC9370719.
- Khaliq R, Antofie MM. Means and Tools For Conservation Of Agrobiodiversity In Pakistan. Agri-Food. 2014; 83.
- Schmitz S, Barrios R, Dempewolf H, Guarino L, Lusty C, Muir J. Crop Diversity, its Conservation and Use for Better Food Systems. In Science and Innovations for Food Systems Transformation. Cham: Springer International Publishing. 545-552.
- Thrupp LA. Linking agricultural biodiversity and food security: the valuable role of agrobiodiversity for sustainable agriculture. Int Aff. 2000;76(2):265-81. doi: 10.1111/1468-2346.00133. PMID: 18383639.
- Wang SM, Zhang ZW. The State of the World's Plant Genetic Resources gor Food and Agriculture. Journal of Plant Genetic Resources. 2011; 12(3): 325-338.
- KC KB, Pant LP, Fraser EDG, Shrestha PK, Lama A. Assessing links between crop diversity and food self-sufficiency in three agroecological regions of Nepal. Regional Environmental Change. 2016; 16:1239–1251.
- Frison EA, Cherfas J, Hodgkin T. Agricultural biodiversity is essential for a sustainable improvement in food and nutrition security. Sustainability. 2011; 3(1): 238-253.
- Bhandari S, Yadav PK, Rijal S. Home Garden; an Approach for Household Food Security and Uplifting the Status of Rural Women: A Case Study of Saptari, Nepal. Turkish Journal of Agriculture-Food Science and Technology. 2021; 9(10): 1792-1798.
- Aryal K, Partap U, Chaudhary RP, Pandey A, Tandin T, Uprety Y, Chettri N. Agrobiodiversity in the Kangchenjunga Landscape: Status, threats, and opportunities. 2021.
- Joshi BK, Gorkhali NA, Pradhan NN, Ghimire KH, Gotame TP, KC P, Mainali R, Karkee A, Paneru R. Agrobiodiversity and its Conservation in Nepal. Journal of Nepal Agricultural Research Council.2020; 6: 14-33.
- Joshi BK. Agrobiodiversity indicators and measurement using R for description, monitoring, comparison, relatedness, conservation, and utilization. Agrobiodiversity & Agroecology. 01 (01): 47-64. DOI: https://doi. org/10.33002/aa010103..
- Bai YL, Fu C, Thapa B, Rana RB, Zhang LX. Effects of conservation measures on crop diversity and their implications for climate-resilient livelihoods: the case of Rupa Lake Watershed in Nepal. J Mt Sci. 2022;19(4):945-957. doi: 10.1007/s11629-020-6426-3. Epub 2022 Apr 13. PMID: 35432490; PMCID: PMC9005915.
- Pradhan B, Rayamajhi K, Khanal S. Assessment of on-Farm Management and Associated Knowledge of Agro-Biodiversity in Climate Smart Villages of Nawalpur District in Nepal. SAARC Journal of Agriculture. 2021; 19: 259-268.
- Singh K. Agrobiodiversity, Status, and Conservation Strategies. In Agro-biodiversity and Agri-ecosystem Management. Singapore: Springer Nature Singapore. 2022; 27-32.
- Baul TK, Tiwari KR, Mcdonald MA. Exploring agrobiodiversity on farm: A case from Middle-hills of Nepal. Small scale Forestry. 2013; 12(4): 611-629.
- CBS. District Profile, Kavrepalanchwok, Nepal. Central Bureau of Statistics. 2017; 169.
- Paudel B, Acharya BS, Ghimire R, Dahal KR, Bista P. Adapting agriculture to climate change and variability in Chitwan: long-term trends and farmers’ perceptions. Agricultural Research. 2014; 3: 165-174.
- Bhusal P, Ghimire B, Khanal S. Assessing link between on farm agro-biodiversity and food self-sufficiency in two agro-ecological regions of Nepal. Environment & Ecosystem Science (EES). 2021; 5(2): 78-84.
- Pandey S. Factors affecting crop diversity in farmers' fields in Nepal. Renewable Agriculture and Food Systems. 2015; 30(2): 202-209. doi:10.1017/S1742170513000367
- Baul TK, Rahman MM, Moniruzzaman M, Nandi R. Status, utilization, and conservation of agrobiodiversity in farms: a case study in the northwestern region of Bangladesh. International Journal of Biodiversity Science Ecosystem Services & Management. 2015; 11(4): 318-329.
- Manandhar TD, Shin MY. How community-based forest management can improve rural livelihoods: A case of Kabhre district, Nepal. Forest Science and Technology. 2013; 9(3): 131-136.
- Khanal S, Khanal D, Kunwar B. Assessing the Structure and Factors Affecting Agrobiodiversity of Home Garden at Katahari Rural Municipality, Province 1, Nepal. Journal of Agriculture and Environment. 2019; 20: 129-143.
- Schupp JL, Sharp JS. Exploring the social bases of home gardening. Agriculture and Human Values. 2012; 29: 93-105.
- Magurran AE. Measuring Biological Diversity. Blackwell Science. 350 Main Street, Malden, MA 02148-5020, USA. 2004; 261p.
- Zaldivar ME, Rocha E, Castro E, Barrantes R. Species diversity of edible plants grown in home gardens of Chibchan Amerindians from Costa Rica. In: Human Ecology. 2002; 30(3): 301-316.
- Semu AA. The Study of Home Garden Agrobiodiversity, Practices of Home Gardening And Its Role For In-Situ Conservation Of Plant Biodiversity in Eastern Hararghe, Kombolcha Town Oromia Regional State Ethiopia. Open Journal of forestry. 2018; 8: 229-246.
- Tuomisto H. A diversity of beta diversities: straightening up a concept gone awry. Part 1. Defining beta diversity as a function of alpha and gamma diversity. Ecography. 2010; 33: 2-22.
- FAO. Guidelines for the preparation of livestock sector reviews. Animal Prodcution and Health Guidelines. Rome, Italy. 2011; 66.
- Sunwar S. Home gardens in western Nepal: opportunities and challenges for on-farm management of agrobiodiversity. M.S. Thesis, Swedish Agriculture University and Uppsala University, Sweden. 2003; 42.
- Das T, Das AK. Conservation of plant diversity in rural homegardens with cultural and geographical variation in three districts of Barak Valley, Northeast India. Economic Botany. 2015; 69: 57-71.
- Kehlenbeck K, Maass BL. Crop diversity and classification of home gardens in Central Sulawesi, Indonesia. Agroforestry Systems. 2004; 63: 53-62.
- Mburu SM, Koskey G, Kimiti JM, Ombori O, Maingi JM, Njeru EM. Agrobiodiversity conservation enhances food security in subsistence-based farming systems of Eastern Kenya. Agriculture and Food Security. 2016; 5: 19-28.
- Acharya KP. Linking trees on farms with biodiversity conservation in subsistence farming systems in Nepal. Biodiversity & Conservation. 2016; 15: 631-646.
- Paudel B, Rana RB, Sthapit BR, Maharjan SK, Shrestha A, Shrestha P, Gurung AR, Regmi BR, Basnet A, Adhikari A. Determinants of agriculture biodiversity in Western Terai landscape complex of Nepal.Munich Personal RePEc Archive. 2012.
- Joshi N, Kehlenbeck K, Maass BL. Traditional, neglected vegetables of Nepal: Their sustainable utilization for meeting human needs. Conference on international agricultural research for development, October 9-11, 2007. Germany. 11.
- Rocky P, Sahoo U. Proximate constituents of some home garden food crops and household food security in Mizoram, northeast India. Indian Journal of Hill Farming. 2019; 32: 71-78.
- Bistaa SK, Joshib H, Yadavc PK. Assessing The Structures And Factors Affecting On-Farm Agrobiodiversity In Home Gardens Of Farwestern Nepal. Education. 2022; 86(13.3): 88-9.
- Kahane R, Hodgkin T, Jaenicke H, Hoogendoorn C, Hermann M, Keatinge JD. Agrobiodiversity for food security, health and income. Agronomy for Sustainable Development. 2013; 33(4): 671–693.