Research Article
Development and quality evaluation of Jam from Watermelon (Citrullus Lanatus) and Pawpaw (Carica Papaya) juice

Adedeji Temileye Omotayo*
Department of Food Science and Technology, Osun State Polytechnic, Iree, Nigeria
*Address for Correspondence: Adedeji TO, Department of Food Science and Technology, Osun State Polytechnic, P.M.B. 301, Iree, Osun State, Nigeria, Email: [email protected]
Dates: Submitted: 21 November 2017; Approved: 27 November 2017; Published: 28 November 2017
How to cite this article: Adedeji TO. Development and quality evaluation of Jam from Watermelon (Citrullus Lanatus) and Pawpaw (Carica Papaya) juice. Arch Food Nutr Sci. 2017; 1: 063-071. DOI: 10.29328/journal.afns.1001010
Copyright License: © 2017 Adedeji TO. This is an open access article distributed under the Creative Commons Attribution License, which permits unrestricted use, distribution, and reproduction in any medium, provided the original work is properly cited.
Keywords: Pawpaw; Watermelon; Jam; Sensory; Microbial; Physicochemical
Abstract
The seasonal nature of most fruits available in the market coupled with inadequate storage and processing facilities has limited their consumption by majority of the people in the country. Jams made from fruits are good bread spread rather than any other food products because they serve as adequate balance diet and it contains antioxidant such as vitamin C and A which play an important role in preventing cancer, cardiovascular problem and improvement of eyesight. Pawpaw and watermelon fruits have been reported to be nutritive and high in antioxidant properties that can scavenge free radicals, thereby improving the antioxidant status of the body. It is therefore deemed fit to produce jam from these perishable commodities in other to make them available all through the year and as well as adding to varieties of food products. The aqueous extracts of watermelon with pawpaw juice were processed into jam and the physicochemical properties of the jam samples were analysed. The resulting jam samples showed moisture content ranging between 30.60-35.30%, protein 0.40-0.80%, fat 0.20-0.40%, ash 1.20-1.70%, crude fibre 0.10-0.30%, carbohydrate 62.10-67.16%, β-carotene 610-1350µg/100g and ascorbic acid 9.60-15.40mg/100g. The jam samples were found to be very nutritive and high in antimicrobial and antioxidant properties that can scavenge free radicals, thereby can improve the antioxidant status of the body. Sensory evaluation tests showed that the samples were acceptable and compared favourably with the commercial imported brand while sample AA had the highest preference in all the sensory attributes evaluated by the panellists. Microbiological examination also showed that the jam samples had total plate count ranging from 4.10x101 to 2.00 x101 cfu/g, yeast and mould count ranged from 2.10x101 to 1.00 x101cfu/g with no observable coliform count.
Introduction
Watermelon (Citrullus lanatus) belongs to the family Cucurbitaceae, the same family as cucumber, pumpkin, and squash. It grows in countries that have a long, warm growing season such as China, Africa, India, and the United States [1]. China is the world’s largest watermelon producer with 13.9 billion pounds produced in 2008, followed by Turkey, Iran, Brazil, and the United States, which produced 4.3 billion pounds that same year [2]. The major producing state is Florida with 817 million pounds produced in 2009, followed by California, Georgia, Texas, and Arizona [3]. Watermelon originated in Africa and it has been an important vegetable in Egypt for at least 4,000 years [4]. By the tenth century AD, it was grown in China and South Russia and was later introduced to the New World by the Spaniards in the sixteenth century [5]. For many years, it has been a source of water in the Kalahari Dessert and other areas of Africa. Watermelons are mostly eaten fresh, but in Africa they can also be cooked [6]. In south parts of the old Soviet Union, watermelon juice is made into a fermented drink or it can be boiled down into syrup [7]. The rind can be pickled or candied and the seeds can be roasted or eaten as it is done in the Orient and Middle East [7].
Pawpaw (Carica papaya) is a member of the small family (Caricacea), having four genera and thirty-one species, is a native of tropical America, now spread all over the tropical region of the world [7]. The fruits are eaten green or ripe, fresh or in salads because of its high sugar content (59%) and thus can be used for wine production [8]. They are also used for making juice and crystallized fruit [9]. Processed, it has a neutral taste that can be considered improved by the addition of passion fruit to make soft drinks and various preserves [10]. It can also be used in production of latex [11].
Carica papaya lower trunk is conspicuously scarred where leaves and fruit were borne. The ripe fruit is usually eaten raw, without skin or seeds [12]. The black seeds are edible, have a sharp, spicy taste, and served as a substitute for black pepper. The pawpaw plant can be monoecious, dioecious or harmaphrolitic [13]. The pawpaw fruit is berry, developing from syncarpous superior ovary with parietal placentation. Carica papaya is a very nutritious fruit. It is high in vitamins, magnesium, iron, copper and several essential amino acids, and also contains significant amounts of riboflavin, niacin, calcium, phosphorus and Zinc [14]. It contains nutrients in amount that is generally almost the same as mangoes, banana, apples, oranges, and pear. The pawpaw juice makes a popular beverage. Young leaves, shoots, and fruits are cooked as vegetable [15].
According to World Health Organization (WHO), estimates of about 60% of deaths in the world are caused by non-communicable diseases. In 2005, an estimated 17.5 million people died of cardiovascular disease (CVD) representing 30% of all global deaths of which 80% were from low- and middle-income countries [16]. By 2020, studies reveal that mortality by CVD is expected to increase by 120% for women and 137% for men. These findings highlight the need to explore possibilities of minimizing or eradicating CVDs and other non-communicable diseases in developing countries such as Nigeria [17].
The seasonal nature of most fruits available on the Nigerian market coupled with inadequate storage and processing facilities has limited the consumption of these commodities by majority of the people in the country [18]. Pawpaw and watermelon fruits have been reported to be nutritive and high in antimicrobial and antioxidant properties that can scavenge free radicals, thereby improving the antioxidant status of the body [19]. It is therefore deemed fit to produce jam from these fruits in other to make them available all through the year and as well as providing varieties to food commodities. This will indeed be of benefit to the people in terms of food quality, well-being and economy. Hence, the objective of this research work was to add value to pawpaw and watermelon by processing them into jam and to determine the physicochemical properties, microbial analysis and the acceptability of the product.
Materials and Methods
Materials
Watermelon and pawpaw were obtained from Iree, Osun State, Nigeria. Other materials include sugars, flavour and pectin that were sourced from a local dealer in the same state. All reagents used in the study were of analytical grade.
Methods
Watermelon and pawpaw fruits were sorted, washed and peeled. They were further diced and blended in a coffee mill with 20mls or 200mls of water separately. They were then sieved into a covered container and kept in a refrigerator at a temperature of 4-100C until used. The juices were mixed in various ratio: watermelon extract to pawpaw (90:10, 80:20, 70:30, 60:40 and 50:50) v/v after the addition of sugar at 75%w/v sugar to extract, pectin at 2% ratio, 5ml lemon juice and 2ppm sodium benzoate as shown in Table 1. The blends were then boiled with constant stirring for 10minutes. The jam samples were filled into sterile glass jam bottles and pasteurized at 750C for 15 mins. The modified method of Fellows was used for the production of the jam [20] (Figure 1)..
| Table 1: Sample Codes and Designation of watermelon-pawpaw jam samples. | ||
| Sample codes | Watermelon | Pawpaw |
| FF | 90 | 10 |
| BB | 80 | 20 |
| AA | 70 | 30 |
| DD | 60 | 40 |
| EE | 50 | 50 |
| CC | - | - |
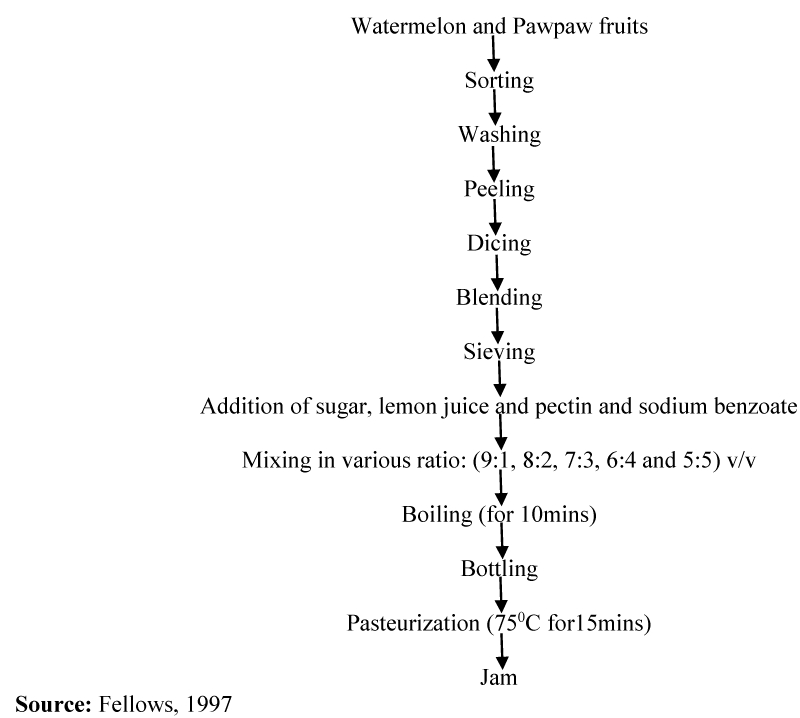
Figure 1: Flowchart for the production of watermelon-pawpaw jam.
Sensory evaluation
The jam produced from a blend of watermelon and pawpaw juice was evaluated by a panel of ten trained panellists from Food Science and Technology department who are familiar with jam. The order of presentation of samples to the panel was randomized. Tap water was provided for each panellist to rinse their mouth in-between evaluations. The samples were rated for colour, taste, mouth feel, flavour, spreadability and overall acceptability on a 9-point Hedonic scale where 1 rep extreme dislike and 9 excellent likenesss. Analysis of variance of the sensory evaluation was determined according to the procedure by Iwe [21].
Proximate analysis
Determination of dry matter and moisture content: About 2ml of each sample was measured into a previously weighed crucible, dried over water for sometimes. The crucible plus sample taken was transferred into the oven set at 1000C to dry to a content weight for 24hours. After this, the crucible plus sample was removed from the oven and transfer to the desiccator, cooled for ten minutes and weighed by Association of Analytical Chemist, 2005, [22]. The weight of empty crucible is W0; the crucible plus sample was W1while the weight of crucible plus oven dried sample was W3.
% Dry matter = X 100
% Moisture = x 100
% Moisture content = 100 - % Dm
Fat determination
This was carried out using the method of AOAC [22]. Clean and dried thimble was weighed (W1) and 5g oven dried sample was added and re-weighed (W2). Round bottom flask was filled with petroleum (ether 40-60)0C up to ¾ of the flask. Soxhlet extractor was fixed with are flux condenser to adjust the heat sources so that the solvent boils gently, the samples were put inside the thimble and inserted into the soxhlet apparatus and extraction under reflux was carried out with petroleum ether for 6 hours. After the barrel of the extractor is empty, the condenser was removed as well as the thimble, taken into the oven at 100oC for 1 hour and later cooled in the dessicator and weighed again (W3).
Determination of crude fibre
This was carried out using AOAC [22]. The sample was measured into a 600ml long beaker and 200ml of hot 1.25% H2S04 was added to it. The beaker was then placed on the digested apparatus that had been pre-heated. The content was then boiled and refluxed for 30 minutes. The content was then filtered through Whatman GF/A paper by gravity. The beaker was rinsed with distilled water and the residue was transferred from the paper back into the beaker with the aid of 1.25% hot sodium hydroxide (Na0H) and the volume of the Na0H was adjusted to 200mls. The beaker was returned onto the digestion apparatus, boiled and refluxed for 30 minutes. It was then filtered and rinsed. The paper was then transferred with residue into a crucible and dried at 1000C overnight. It was then cooled in a dessicator and weighed. The sample was then placed in a furnance at 6000C for 6 hours then cooled in a dessicator and reweighed (weight B). The loss in weight during incineration represents the weight of crude fibre in the sample.
Determination of crude protein
About 1g of the samples was weighed into micro Kjeldahl digestion flask and one tablet of Selenium catalyst was added. The mixture was digested on an electrothermal heater until clear solution was obtained. The flask was allowed to cool after which the solution was diluted with distilled water to 50ml and 5mls of this was transferred into the distillation apparatus, 5mls of 2%boric acid was pippeted into a 100ml conical flask (the receiver flask) and four drops of screened methyl red indicator were added. About 50% NaOH was continually added to the digested sample until the solution turned cloudy which indicated that the solution had become alkaline. Then distillation was carried out into the boric acid solution in the receiver flask with the delivery tube below the acid level. As the distillation was going on, the pink colour solution of the receiver flask turned blue indicating the presence of ammonia. Distillation was continued until the content of the flask was about 50mls after which the delivery of the condenser was rinsed with distilled water. The resulting solution in the conical flask was then titrated with 0.1M HCl AOAC [22].
Microbiological Analysis
Total viable count of bacteria (TVC): The microbiological analysis was carried out according to ICMSF [23]. Plate count agar was used for enumeration of bacteria. A well homogenized sample was serially diluted with 0.1% peptone water up to 10-6. One ml aliquot from a suitable dilution was transferred aseptically into sterile petri dishes. To each plate about 15ml of melted and cooled PDA (Potato Dextrose Agar) was added. The inocula was evenly mixed with media by rotating the plates and allowed to solidify. The inverted plate was incubated for 48hours. The TVC (cfu/ml) was determined using a colony counter.
Total coliform bacteria
Mac Conkey broth was used for the detection of coliform bacteria by the multiple tube technique. The medium was distributed in 9ml quantities standard test tubes with inverted Durham tube and was then autoclaved for 20mins at 1210C. Well homogenized samples were serially diluted (10-1 and 10-2) with 0.1% peptone water, 1 ml from each dilution was aseptically inoculated into triplicate of 9 ml sterile Mac Conkey broth in standard test tube and incubated for 48hrs at 370C. Positive tests gave gas in the Durham tubes and changed the color of the medium [23].
Results and Discussions
Proximate composition of the formulated jam
The result of the proximate compositions of the formulated jam is shown in table 2. The moisture content of the formulated jam (30.60±0.10-34.70±0.10) % were found to be lower than the control (35.30±0.20) %. This may be due to pectin that was used in the preparation of the jam. The protein content of the formulated jam was found to be (0.8±0.03-0.5±0.02) % which was higher than that of the control (0.4±0.01) %. The protein content is adequate to meet the FAO/WHO recommended daily allowance of protein of 0.59g/kg body weight for children aged 1-10 years as reported by Ghana Standard Board [24]. The crude fat content of the formulated jam was found to range between (0.40±0.03-0.32±0.03) % which was much higher than that of the control (0.20±0.01) % but compares favourably well with that of the Mediterranean locust bean (Ceratonia siliqua) 0.05% as reported by Stein. This low fat content is an indication that the jam sample can keep for long period at right temperature and moisture without spoilage by oxidative rancidity.
| Table 2: The Proximate Composition of the formulated jam (%). | ||||||
| Sample Code |
Moisture content | Protein | Fat content | Ash Content |
Crude fibre | Carbohydrate |
| FF | 34.7±0.18 | 0.8±0.03 | 0.40±0.03 | 1.70±0.13 | 0.30±0.05 | 62.10±0.18 |
| BB | 33.6±0.15 | 0.7±0.03 | 0.38±0.03 | 1.63±0.12 | 0.22±0.03 | 63.47±0.20 |
| AA | 32.7±0.14 | 0.6±0.03 | 0.36±0.03 | 1.51±0.10 | 0.21±0.03 | 64.62±0.21 |
| DD | 31.9±0.13 | 0.5±0.02 | 0.34±0.03 | 1.44±0.08 | 0.15±0.02 | 65.67±0.22 |
| EE | 30.6±0.10 | 0.5±0.02 | 0.32±0.03 | 1.31±0.06 | 0.11±0.01 | 67.16±0.24 |
| CC | 35.3±0.20 | 0.4±0.01 | 0.20±0.01 | 1.20±0.05 | 0.10±0.01 | 62.8±0.18 |
| Keywords: (AA rep. 90:10, BB rep. 80:20, FF rep. 70:30, DD rep. 60:40 and EE rep. 50:50) watermelon: pawpaw ratio and CC rep. Control- imported commercial brand. | ||||||
The ash content of the formulated jam recorded (1.70±0.13-1.31±0.06) % which is considerably lower than the control (1.0±0.05) % but higher than that of the Mediterranean locust bean (Ceratonia siliqua) fruit pulp (Stein). This implies that the formulated jam could serve as a potential good source of minerals required by the body. It has been reported by Adelakun et al. [25], that ash content is an indication of mineral contents in food. The formulated jam recorded (0.30±0.05-0.11±0.01) % of crude fibre which is higher than that of the control (0.10±0.01) %. This is an indication that the jam is rich in fibre thus exhibiting good elements of a functional food apart from the cherished phytochemicals in them. The jam is similar to that of the imported commercial brand which represents the control which is made from strawberry. Dietary fibres increases faecal output, lowers faecal pH and increases significantly the daily excretion of butyrate of the consumers which are putative markers of colonic health in humans [26,27]. Also, NSRL [28] reported that a diet low in fibre is undesirable as it could cause constipation and associated diseases like piles, appendicitis and colon cancer and several other digestive disorders. Fibre is reported to help in lowering the serum cholesterol, control blood sugar and increase bulk stool and other ailments of the gastrointestinal tract of man.
The carbohydrate content of the jam samples determined by difference ranged from (62.10±0.18-67.16±0.24)% while the control sample had a carbohydrate content of 62.80±0.18%. This is much higher than that of locust bean seeds (49.49)% as reported by Fetuga et al., (1974). It is also higher than most legume seeds with only lentils and Bambara groundnuts coming close to a value of 65.00% [29]. Though protein and fats also provide energy, carbohydrates are much cheaper and more easily digested and absorbed (Fox et al.). With this content of carbohydrate, the jam is a good source of energy given the daily energy intake [29].
Physico-chemical properties of the formulated jam
The physicochemical properties of the formulated jam are shown in table 3. The vitamin C contents of the formulated jam varied between (10.40±0.01-15.40±0.02) mg/100g which was higher than that of the control (9.60±0.01) mg/100g. This is of great health significance. This implies that the formulated jam is very high in vitamin C and may take care of vitamin C deficiency related aliment like scurvy (Edem and Miranda, 2011). This is comparable to the result obtained on vitamin C content (12.50±0.82-27.29±0.94) mg/100g of some selected vegetables like Oha, Ukazi, Nchuanwu and Uziza as reported by Chinma et al., [30]. Despite the losses in vitamin during heat processing, the residual amounts were of appreciable quantities that could still meet the Recommended Daily Intake (RDA) of 30mg/65kg body weight for an adult man, the excess of which could be excreted from the body by urination [31]. Vitamin C loss is known to increase with exposure to heat (as in pasteurization), light and oxygen. It was also reported that a 46% loss of ascorbic acid of small fruits could occur at ambient temperature. Vitamin C is involved in protein metabolism, collagen synthesis and an important physiological antioxidant [32-34]. It also plays an important role in immune function, improves absorption of non-heme iron and participates in biosynthesis of glucocorticoids [35]. The vitamin C content of the jam compared favourably with that reported for pineapple (30.62) mg/100ml and orange (46.24mg/100ml) juice samples [36].
| Table 3: Physico-chemical properties of the formulated jam. | ||||
| Parameters | FF | BB | AA DD | EE CC |
| Β carotene (µg/100g) |
1350±0.50 | 1260±0.45 | 1110±0.40 910±0.35 |
750±0.32 610±0.30 |
| Vitamin C (mg/100g) |
15.40±0.02 | 13.40±0.01 | 12.80±0.01 11.90±0.01 |
10.4±0.01 9.6± 0.01 |
| Keywords: (AA rep. 90:10, BB rep. 80:20, FF rep. 70:30, DD rep. 60:40, EE rep. 50:50) watermelons: pawpaw ratio and CC rep. Control- imported commercial brand. | ||||
The total carotenoid of the formulated jam recorded (1350±0.50-750±0.32)µg/100g which was higher than that of the control sample (610±0.30)µg/100g. This implies that the jam contains a considerable amount of carotenoids which can fight against diseases like age- related muscular degenerative disease, hypercholesterolemia, cardiovascular disease, hypertension, diabetics and onset of cancer occurrence in human being [37,38]. Also, the value of carotenoids indicates that the jam is a potential source of vitamin A given that the recommended daily intake is 750 µg/100g per 65kg adult human [29]. The carotenoids content of the formulated jam was found to be higher than that of Oha leaf (0.07µg/100g), Ugu leaf (0.02µg/100g) as reported by Onyeka, et al., [39]. The carotenoid content of the formulated jam was lower than that obtained for some commonly consumed foods like yellow maize (200µg/100g), plantain (800µg/100g), cabbage (2000µg/100g), mango (3,000µg/100g) and carrots (12,000µg/100g) as reported by Muller [29]. Carotenes are usually converted to retinol (Vitamin A) in the small intestine, and its colour also makes food more attractive to the eye. The high levels of carotenoids in the jam could be as a result of red (coloured) pigment.
The Microbiological evaluation of the formulated jam
The microbial load of the formulated jam is shown in table 4. The result showed that the total plate count of 2.0 x101 cfu/g for the formulated jam sample was lower than that of 4.1 x 101 cfu/g of imported commercial brand. Likewise, that of yeast and mould counts of 1.0 x101 cfu/g respectively for the formulated jam was lower than that of 2.1 x101 cfu/g for the control. The results indicated that all the samples were free from coliforms. This is an indication that all the samples are safe for human consumption, moreover with the total plate counts not exceeding the acceptable limits of >105 recommended by the International Commission of Microbiology Specifications of Foods, ICMSF [23].
| Table 4: The Microbiological evaluation of the formulated jam (cfu/g). | ||||
| Sample Code |
TVC | TYC | TMC | TCC |
| FF | 2.0x101 | 1.0 x101 | 1.0 x101 | - |
| BB | 2.0x101 | 1.0 x101 | 1.0 x101 | - |
| AA | 2.0x101 | 1.0 x101 | 1.0 x101 | - |
| DD | 2.0x101 | 1.0 x101 | 1.0 x101 | - |
| EE | 2.0x101 | 1.0 x101 | 1.0 x101 | - |
| CC | 4.1x101 | 2.1 x101 | 2.1 x101 | - |
| Keywords: (AA rep. 90:10, BB rep. 80:20, FF rep. 70:30, DD rep. 60:40, EE rep. 50:50) watermelons: pawpaw ratio and Control rep imported commercial brand, - rep no microbial growth. | ||||
The Sensory evaluation of the formulated jam
The sensory evaluation of the formulated jam is presented in table 5. The result showed that the formulated jam compares very well with the imported strawberry jam in terms of colour, taste, mouth feel, flavour, spread ability and overall acceptability. Sample FF had the best rating in all the sensory attributes evaluated while sample CC had the least rating in all the sensory attributes evaluated by the panellists. Interestingly, this observation agrees with the result of the chemical analysis in which sample FF showed better nutritional qualities. Varying the proportion of pawpaw to watermelon ratio did not result into significant (p< 0.5) change in almost all the sensory attributes evaluated?
| Table 5: The Sensory evaluation of the formulated jam. | ||||||
| Sample Codes |
Colour | Taste | Mouth feel | Flavour | Spreadability | Overall Acceptability |
| FF | 6.41 | 5.00 | 6.83 | 5.01 | 7.21 | 6.83 |
| BB | 5.66 | 4.80 | 6.80 | 4.71 | 6.80 | 6.81 |
| AA | 5.34 | 4.80 | 6.61 | 4.70 | 6.32 | 6.40 |
| DD | 5.16 | 4.51 | 6.50 | 4.32 | 6.31 | 6.31 |
| EE | 5.16 | 4.50 | 6.01 | 4.30 | 6.29 | 6.30 |
| CC | 5.00 | 3.17 | 5.51 | 3.33 | 5.10 | 5.83 |
| Keywords: (AA rep. 90:10, BB rep. 80:20, CC rep. 70:30, DD rep. 60:40, EE rep. 50:50) watermelon: pawpaw ratio and FF rep. Control sample- imported commercial brand. | ||||||
Conclusion
From the result above, it can therefore be concluded that jam made from watermelon and pawpaw extract is highly nutritious and good for human consumption. The jam samples are safe for human consumption if prepared under safe, hygienic conditions in air-tight containers and kept in a refrigerator at a temperature of ±40C. Further research work can be carried out to investigate the preservative effects of natural spices like ginger, garlic, alligator pepper, cloves etc. either singly or in combination with one another on the jam samples.
References
- Maynard DN. Watermelons: Characteristics, Production, and Marketing. Alexandria: ASHS Press. 2001; 227. Ref.: https://goo.gl/AuK6hM
- ERS and USDA. Vegetables and Melons Yearbook Data. Economic Research Service US Department of Agriculture. 2011. Ref.: https://goo.gl/VNfSrS
- USDA, and NASS. Vegetables 2009 Summary, US Department of Agriculture National Agricultural Statistics Service. 2010; 84.
- Perkins-Veazie P, Collins JK, Siddiq M, Dolan K. Juice and Carotenoid Yield from Processed Watermelon. J Horticul Sci. 2006; 41: 510-518. Ref.: https://goo.gl/9RoLNW
- Dimitrovski D, Bicanic D, Luterotti S, van Twisk C, Buijnsters JG, et al. The Concentration of Trans-Lycopene in Postharvest Watermelon: An Evaluation of Analytical Data Obtained by Direct Methods. J Postharvest Biol Technol. 2010; 58: 21-28. Ref.: https://goo.gl/djSuid
- Quek S, Chok N, Swedlund P. The physicochemical Properties of Spray-Dried Watermelon Powders. J Chemical Engg Process. 2007; 46: 386-392. Ref.: https://goo.gl/qXdSBE
- Falade K, Igbeka J, Ayanwuyi F. Kinetic of Mass Transfer and Colour Changes During Osmotic Dehydration of Watermelon. J Food Engg. 2007; 80: 979-985. Ref.: https://goo.gl/7wGqZj
- Pomper KW, Layne DR. The North American Pawpaw: Botany and Horticulture. Horticul Reviews. 2005; 3: 351-354. Ref.: https://goo.gl/SwVybz
- Ayoola PB, Adeyeye A. Phytochemical and Nutrient Evaluation of Carica Papaya (pawpaw) Leaves. Int J Recent Research App Studies. 2010; 5: 101-107. Ref.: https://goo.gl/iP8Fqh
- Ihekoronye AI, Ngoddy PO. Integrated Food Science and Technology for the Tropics. Macmillan Publishers Ltd. 1985; 65-193. Ref.: https://goo.gl/z3f1Dm
- Jones SC, Peterson NR, Turner TA, Pomper KW, end Layne DR. Pawpaw Planting Guides (PIB-002). Frank fort: Kentucky State University Cooperative Extension Program. 1999.
- Oloyede OI. Chemical Profile of Unripe Pulp of Carica papaya (pawpaw). Pakistan J Nutrition. 2005; 4: 379-381. Ref.: https://goo.gl/jdu3X3
- Nwinyi Chukwuemeka O, Anthonia AB. Antifungal Effects of Pawpaw Seeds Extracts and Papain on Post-Harvest of Carica papaya L. Fruit Rot. African J Agricul Research. 2010; 5: 1531-1535. Ref.: https://goo.gl/YWK9uL
- Doughari JH, Elmahmood AM, Manzara S. Studies on the Antibacterial Activity of Root Extracts of Carica papaya. African J Microbiol Research. 2007; 37-41. Ref.: https://goo.gl/FNmyDQ
- Mahmood, AA, Sidik K, Salmah I. Wound Healing Activity of Carica papaya L. Aqueous Extracts in Rats. Int J Molecul Med Adv Science.2005; 1: 398-401. Ref.: https://goo.gl/iJoFCx
- WHO. World Health Survey. World Health Organisation. 2010.
- BeLue R, Okoro TA, Iwelunmor J, Taylor KD, Degboe AN, et al. An Overview of Cardiovascular Risk Factor Burden in Sub-Saharan African Countries: A Socio-Cultural Perspective. Global Health. 2009; 5: 10-20. Ref.: https://goo.gl/d7Npta
- Falana IB. Effects of Low Irradiation Doses and Some Physical Treatments on the Keeping Qualities of Plantain (Musa AAB). 1997; 215.
- Adedeji TO, Oluwalana IB. Physicochemical, Sensory and Microbial Analysis of Wine produced from Watermelon (Citrullus lanatus) and Pawpaw (Carica papaya) Blend. J Food Science and Quality Management. 2013; 19: 41-50. Ref.: https://goo.gl/UYVBLk
- Fellows P. Guidelines for Small Scale Fruits and Vegetable Processors. FAO Agricultural Science Bulletin-127. 1997. Ref.: https://goo.gl/Bd6bdx
- Iw MO. Handbook of Sensory methods and Analysis. 1st edition. 02.
- AOAC. Association of Analytical Chemist (25th edition). Official Methods of Analysis. 2005.
- ICMSF. International Commission of Microbiology Specifications of Foods in Microbial Ecology of Food Commodities. 2005; 2: 522-532.
- Ghana Standard Board. Specification for Fruit Squashes and Fruit Cordials. 1995.
- Adelakun OE, Oyelade OJ, Ade-Omowaye BIO, Adeyemi IA, Vanderventer MO, et al. Influence of Pre-Treatment on Physicochemical and Functional Properties of a Nigeria Okro Seed (Albemoschus esculentus moench) flour. Food and Chemical Toxicol. 2009; 47: 657-661. Ref.: https://goo.gl/PQZH1G
- Phillips J, Muir JG, Birkett A, Zhong XL, Jones PJ, et al. Effect of Resistant Starch on Faecal Bulk and Fermentation-Dependent Events in Humans. Am J Clin Nutr. 1995; 62: 112-116. Ref.: https://goo.gl/e4dzRF
- Cummings JH, Beatty ER, Kingman SM, Bingham SA, Englyst HN. Digestion and Physiological Properties of Resistant Starch in Human Bowels. Br J Nutr. 1996; 75: 733-738. Ref.: https://goo.gl/uosiFo
- NSRL: National Soyabean Research Laboratory. A publication of National Soybean Research Laboratory on Soybean Processing; from field to consume. 2002.
- Muller HG. An Introduction to Tropical Food Science. Cambridge University Press. 1998; 16-46; 112-118. Ref.: https://goo.gl/BsBzvx
- Chinma CE, Igyor MA. Micronutrients and Anti-Nutritional Contents of Selected Tropical Vegetables Grown in South East, Nigeria. Nigeria Food Journal. 2007; 25: 111-116. Ref.: https://goo.gl/zxJb5j
- Olson JA, Hodges RE. Recommended Dietary Intake (RDI) of Vitamin C in Humans. Am J Clin Nutr. 1987; 45: 693-703. Ref.: https://goo.gl/gR8AVD
- Li Y, Schellhorn HE. New Developments and Novel Therapeutic Perspectives for Vitamin C. J Nutr. 2007; 137: 2171-2184. Ref.: https://goo.gl/CjZQwt
- Car C, Frei B. Toward a New Recommended Dietary Allowance for Vitamin C Based on Antioxidant and Health Effects in Human Blood Plasma. Am J Clin Nutr. 1999; 69: 1086-1107. Ref.: https://goo.gl/vyNSXM
- Jacob RA, Stoudeh G. Vitamin C Function and Status in Chronic Disease. Nutrition & Dietary Care. 2002; 5: 66-74. Ref.: https://goo.gl/8pzXyo
- Gershoff SN. Vitamin C (ascorbic acid): New Roles, New Requirements. J Nutri Revol. 1993; 51: 313-326. Ref.: https://goo.gl/nPWcZ9
- Omobuwajo TO, Ogunsua AO, Abiose SH, Adeyemi IA. Prospects for Sustainable Growth of the Food and Beverage Industry In Nigeria Based On Locally Available Resources. The Obafemi Awolowo University. A Paper Presented at the 17th Annual Conference of the Nigerian Institute of Food Science and Technology. 1993.
- Menottetali A, Krombout D, Blackburn H, Fidance F, Huzuna R, et al. Food Intake Pattern and 25years Mortality from Coronary Heart Disease Cross Cultural Correlations in the Seven Countries Study Research Group. Human Journal of Epidemiology. 1999; 15: 507-515. Ref.: https://goo.gl/Tobfmy
- Krinsky NI. Actions of Carotenoids in Biological Systems. Annu Rev Nutr. 1993; 13: 1-87. Ref.: https://goo.gl/T9rHR5
- Onyeka EU, Nwambekwe IO. Phytochemical Profile of Some Green Leafy Vegetables in South East, Nigeria. Nigeria Food Journal. 2007; 25: 67-76. Ref.: https://goo.gl/crfSXo